7 Best Map Design Methodologies for Intuitive Navigation
Maps that confuse users don’t just frustrateâthey fail completely at their core mission of helping people navigate and understand spatial information. User-centered design transforms traditional cartography from an art form into a science that prioritizes how real people interact with geographic data.
The shift toward human-focused mapping methodologies has revolutionized everything from mobile navigation apps to emergency response systems. You’ll discover seven proven approaches that put your users’ needs first and create maps that actually work in the real world.
Disclosure: As an Amazon Associate, this site earns from qualifying purchases. Thank you!
Understanding User-Centered Map Design Principles
These fundamental concepts guide every successful mapping project that prioritizes user needs over aesthetic preferences alone.
P.S. check out Udemy’s GIS, Mapping & Remote Sensing courses on sale here…
Defining User-Centered Design in Cartography
User-centered design in cartography prioritizes your map users’ specific goals and cognitive abilities throughout the design process. You’ll conduct user research to understand how people interact with spatial information before creating visual elements. This approach ensures your maps support actual user tasks rather than displaying data for its own sake. Professional cartographers now integrate usability testing and user feedback loops into their standard workflows.
Explore and map the wilderness for the Queen in Cartographers! Draw unique terrain shapes and score points based on randomly selected goals each game, but beware of monster ambushes.

Core Principles of Effective Map Design
Visual hierarchy guides users through your map by emphasizing important features through size, color, and contrast differences. You’ll apply cognitive load reduction by limiting simultaneous information and grouping related elements together. Consistency across symbols, fonts, and color schemes helps users predict how your map functions. Accessibility ensures your design works for users with different visual abilities and technical constraints.
Benefits of User-Focused Mapping Approaches
Improved task completion rates result when you design maps that match users’ mental models of spatial relationships. You’ll see reduced user errors because intuitive design prevents misinterpretation of geographic information. Higher user satisfaction occurs when maps feel effortless to use and provide exactly the information people need. Better business outcomes follow as users accomplish their goals more efficiently with well-designed mapping interfaces.
Human-Centered Design Methodology
Human-centered design methodology places real user needs at the core of every mapping decision. This systematic approach transforms geographic visualizations from data-heavy displays into intuitive navigation tools.
Empathy Mapping for Geographic Visualizations
Empathy mapping reveals the emotional and cognitive experience users have with your maps. You’ll document what users see, think, feel, and do when interacting with geographic data. Create quadrant charts capturing user frustrations like “overwhelmed by too many symbols” or motivations such as “need quick route decisions.” Map these insights to specific design elements – reducing symbol complexity when users feel confused or highlighting key landmarks when they express uncertainty about location context.
User Journey Mapping in Cartographic Context
User journey mapping traces the complete path users take when accomplishing location-based tasks with your maps. You’ll identify touchpoints from initial map loading through final destination arrival, noting pain points at each stage. Document specific moments like “zooming in causes symbol overlap” or “legend positioning blocks route view.” This process reveals critical design opportunities – perhaps simplifying zoom-level transitions or repositioning interface elements to maintain clear sight lines to essential geographic information.
Iterative Design Process Implementation
Iterative design implementation cycles through rapid prototyping, testing, and refinement phases specifically for cartographic products. You’ll create low-fidelity wireframes testing symbol hierarchy before investing in detailed geographic databases. Test prototypes with 5-8 users per iteration, focusing on task completion rates and error patterns. Implement changes like adjusting color contrast ratios or modifying label placement based on user feedback, then retest immediately. This approach prevents costly redesigns while ensuring your final maps truly serve user navigation needs.
Participatory Mapping Methodology
Participatory mapping methodology transforms communities from passive map consumers into active contributors, creating more accurate and culturally relevant spatial representations. You’ll involve local stakeholders directly in the mapping process to capture knowledge that traditional surveying methods often miss.
Community Engagement Strategies
Building trust establishes the foundation for successful participatory mapping projects. You’ll need to attend community meetings and establish partnerships with local leaders before introducing mapping concepts.
Achieve a flawless, even complexion with e.l.f. Flawless Satin Foundation. This lightweight, vegan formula provides medium coverage and a semi-matte finish for all-day wear, while hydrating your skin with glycerin.

Cultural sensitivity shapes your engagement approach. You should respect traditional knowledge systems and understand how communities organize spatial information. Indigenous groups often have unique ways of describing geographic relationships that standard mapping may overlook.
Training workshops empower community members to use GPS devices and mobile mapping applications like KoBoToolbox or Survey123, ensuring they can contribute meaningfully to data collection efforts.
Stay connected anywhere with this compact satellite communicator. Enjoy two-way messaging, interactive SOS, and TracBack routing for confident navigation. Battery lasts up to 14 days in tracking mode.

Collaborative Data Collection Techniques
Crowdsourced data gathering leverages community knowledge through platforms like OpenStreetMap where local residents add missing roads, buildings, and points of interest that commercial datasets miss.
Walking interviews combine spatial exploration with data collection. You’ll accompany community members through neighborhoods while they identify important locations and share stories that reveal the social significance of spaces.
Asset mapping sessions bring groups together to identify community resources on large paper maps or interactive displays. Participants use colored markers to highlight everything from informal businesses to flood-prone areas, creating comprehensive local knowledge databases.
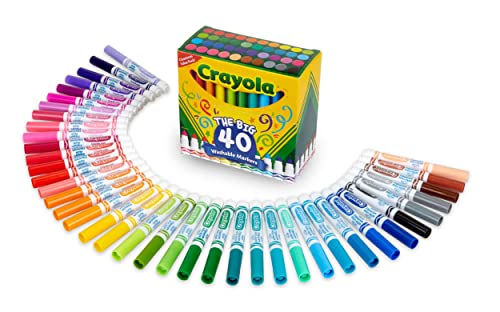
This 40-count set of Crayola Ultra Clean Washable Markers delivers vibrant color for all art projects. Easily washes from skin, clothing, and painted walls, making them perfect for kids ages 3 and up.
Stakeholder Involvement Best Practices
Multi-generational participation ensures comprehensive knowledge capture. You should include both elderly residents with historical knowledge and young people familiar with recent changes in community layouts and usage patterns.
Power dynamics require careful management during group mapping sessions. You’ll need to create separate opportunities for marginalized voices, including women’s groups or minority communities who might not speak up in mixed gatherings.
Data ownership agreements protect community interests while enabling broader map use. You should establish clear protocols about how collected information will be stored, shared, and credited to ensure communities maintain control over their contributed knowledge.
User Experience (UX) Research Methodology
UX research methodology transforms your mapping approach by gathering direct user insights before you design a single cartographic element. This systematic process reveals how users interact with spatial information and guides your design decisions based on evidence rather than assumptions.
Conducting User Interviews for Map Design
Interview your target users to uncover their navigation challenges and spatial reasoning patterns. Structure your sessions with open-ended questions about their mapping goals, preferred visual elements, and common frustrations with existing tools.
Focus your conversations on specific use cases rather than general preferences. Ask participants to describe their last challenging navigation experience or demonstrate how they currently interpret complex geographic data. Record their mental models of spatial relationships and note which cartographic symbols they find most intuitive.
Document pain points where users struggle with scale transitions, symbol recognition, or information hierarchy in current mapping solutions.
Usability Testing for Interactive Maps
Test your interactive prototypes with representative users performing realistic tasks in controlled environments. Set up scenarios that mirror real-world mapping challenges, such as finding specific locations or understanding complex geographic relationships.
Get durable, tear-resistant posters made in the USA. Each 18" x 29" poster features high-quality 3 MIL lamination for lasting protection.

Use screen recording software to capture user interactions while they navigate your interface. Monitor where users click, how long they spend on different map areas, and which features they ignore completely.
Measure task completion rates, error frequencies, and time-to-target metrics across different user groups. Focus particularly on how users handle zoom levels, layer toggles, and search functionality during their testing sessions.
Analyzing User Behavior Patterns
Track user interaction data from existing mapping applications to identify common navigation patterns and decision points. Use heat mapping tools to visualize where users click most frequently and analytics platforms to measure engagement with different map features.
Examine user flow data to understand how people move between different zoom levels and map layers. Identify drop-off points where users abandon tasks and correlate these patterns with specific design elements or information density.
Create user behavior personas based on clustering similar interaction patterns, then design map interfaces that accommodate the most common navigation workflows while addressing edge cases that cause user frustration.
Design Thinking Methodology
Design thinking methodology transforms complex spatial challenges into user-friendly mapping solutions through structured problem-solving phases. You’ll follow a five-stage process that ensures your maps address real user needs rather than assumed requirements.
Problem Definition and Ideation Phases
Define specific mapping challenges by analyzing user pain points and spatial decision-making contexts. You’ll conduct stakeholder interviews to understand navigation frustrations, data accessibility issues, and visualization preferences. Generate diverse solutions through brainstorming sessions that explore unconventional approaches like augmented reality overlays, voice-guided navigation, or simplified symbol systems. Document each problem statement using “How might we…” questions to frame your ideation process effectively.
Prototyping Geographic Solutions
Create low-fidelity wireframes using tools like Figma or Sketch to test map layouts and information hierarchy quickly. You’ll build interactive prototypes with platforms like InVision or Marvel to simulate user workflows and navigation patterns. Develop clickable mockups that demonstrate core functionality including zoom levels, layer toggles, and search capabilities. Focus on essential features first, testing basic interactions before adding complex geographic analysis tools or advanced customization options.
Testing and Refinement Cycles
Conduct usability tests with 5-8 target users per iteration, observing how they interact with your prototyped mapping interface. You’ll measure task completion rates, error frequencies, and time-on-task metrics to identify friction points. Implement feedback loops by documenting user suggestions and prioritizing changes based on impact and feasibility. Run A/B tests comparing different symbol schemes, color palettes, or layout configurations to validate design decisions through quantitative data rather than assumptions.
Accessibility-First Design Methodology
Accessibility-first design methodology ensures your maps serve users with diverse abilities and technical requirements. This approach integrates inclusive design principles from the initial planning stages rather than retrofitting accessibility features after completion.
Universal Design Principles for Maps
Universal design principles create maps that work effectively for users with varying visual, motor, and cognitive abilities. You’ll implement high contrast color schemes with sufficient luminance ratios exceeding 4.5:1 for normal text and 3:1 for large text elements. Design scalable interface elements that accommodate different screen sizes and zoom levels while maintaining readability. Include multiple ways to access information through both visual and text-based alternatives, ensuring your mapping interface remains functional across assistive technologies and standard web browsers.
Color-Blind Friendly Visualization Techniques
Color-blind friendly visualization techniques prevent information loss for users with color vision deficiencies affecting approximately 8% of men and 0.5% of women. You’ll select color palettes using tools like ColorBrewer 2.0 that provide scientifically tested combinations for deuteranopia, protanopia, and tritanopia conditions. Implement pattern fills, texture variations, and symbol shapes alongside color coding to convey categorical information. Test your color schemes using simulators like Coblis or Stark to verify accessibility across different types of color blindness before finalizing your map design.
Screen Reader Compatibility Standards
Screen reader compatibility standards ensure your interactive maps provide meaningful information to users relying on assistive technologies like JAWS, NVDA, or VoiceOver. You’ll implement proper ARIA labels, semantic HTML structure, and descriptive alt text for all map elements including legends, symbols, and interactive features. Structure your map data hierarchically with clear headings and landmark roles that screen readers can navigate efficiently. Provide text alternatives for spatial relationships and include keyboard navigation options that allow users to access all map functions without requiring mouse interactions.
Protect your eyes with RaoOG blue light blocking reading glasses. Featuring flexible spring hinges for a comfortable fit and accurate magnification for clear, distortion-free vision.

Agile Mapping Methodology
Agile mapping methodology adapts software development principles to create responsive, user-focused cartographic solutions. You’ll deliver map products through iterative cycles that emphasize collaboration and continuous improvement.
Sprint-Based Development Approach
Sprint-based development breaks your mapping project into 2-4 week cycles with specific deliverables. You’ll prioritize high-value features like base layer optimization and core navigation elements in early sprints. Each sprint produces a working map prototype that stakeholders can evaluate and provide feedback on. This approach prevents scope creep while ensuring your mapping solution addresses user needs systematically. You’ll maintain a product backlog that ranks features by user impact and technical complexity.
Continuous User Feedback Integration
Continuous user feedback integration embeds testing throughout your development process rather than waiting for project completion. You’ll conduct weekly user sessions with 3-5 participants to evaluate map usability and navigation effectiveness. Feedback collection methods include task-based testing, heat mapping analysis, and post-interaction surveys. This constant input stream helps you identify design issues early and adjust your mapping approach before investing significant development time. You’ll document feedback patterns and prioritize changes based on user impact frequency.
Rapid Prototyping and Iteration
Rapid prototyping and iteration accelerate your design validation through quick testing cycles. You’ll create low-fidelity wireframes using tools like Figma or Sketch within 24-48 hours of sprint planning. Interactive prototypes allow users to test map interactions and information hierarchy before full development. Each iteration cycle lasts 3-5 days and focuses on specific user scenarios like route planning or landmark identification. This methodology reduces development risks while ensuring your final mapping solution meets real-world navigation requirements.
Conclusion
The seven methodologies outlined above represent proven pathways to creating maps that truly serve your users’ needs. Each approach brings unique strengths to your design process whether you’re prioritizing community input through participatory mapping or ensuring universal access through accessibility-first design.
Success in user-centered cartography comes from choosing the right combination of these methodologies for your specific project and audience. You’ll find that integrating multiple approaches – such as combining UX research with agile development cycles – often yields the most effective results.
Your next step is to evaluate your current mapping challenges and select the methodologies that best address your users’ pain points. Remember that great maps aren’t just visually appealing – they’re functional tools that empower users to navigate and understand their world with confidence.
Frequently Asked Questions
What is user-centered design in cartography?
User-centered design in cartography is an approach that prioritizes users’ specific goals and cognitive abilities throughout the map design process. It involves conducting user research, integrating usability testing, and incorporating feedback into workflows to create maps that are functional, intuitive, and serve real navigation needs rather than just looking visually appealing.
How does human-centered design methodology improve mapping?
Human-centered design methodology transforms geographic visualizations into intuitive navigation tools by placing real user needs at the core of mapping decisions. It uses empathy mapping to understand users’ emotional experiences, user journey mapping to identify pain points, and iterative design processes involving rapid prototyping and testing to ensure maps effectively serve navigation needs.
What is participatory mapping and why is it important?
Participatory mapping empowers communities to become active contributors in the mapping process, resulting in more accurate and culturally relevant spatial representations. It involves community engagement strategies, training workshops, and collaborative data collection techniques that leverage local knowledge while respecting traditional knowledge systems and ensuring proper data ownership agreements.
How does UX research methodology benefit map design?
UX research methodology transforms mapping approaches by gathering direct user insights before designing cartographic elements. It involves conducting user interviews to uncover navigation challenges, performing usability testing with realistic scenarios, and analyzing user behavior patterns through interaction data to create personas that inform map interface design and improve user satisfaction.
What are the key phases of design thinking in mapping?
Design thinking in mapping follows five structured phases: problem definition through user pain point analysis, ideation using brainstorming sessions and “How might we…” questions, prototyping with low-fidelity wireframes, testing with target users, and refinement through iterative improvements based on feedback and A/B testing data.
Why is accessibility-first design crucial for maps?
Accessibility-first design ensures maps serve users with diverse abilities by integrating inclusive design principles from initial planning stages. It implements universal design principles, color-blind friendly visualizations, and screen reader compatibility with proper ARIA labels and keyboard navigation, making maps usable for people with varying visual, motor, and cognitive abilities.
How does agile mapping methodology work?
Agile mapping methodology adapts software development principles to create responsive, user-focused cartographic solutions through sprint-based development cycles lasting 2-4 weeks. It emphasizes continuous user feedback integration, rapid prototyping, and iterative improvements to ensure the final mapping solution meets real-world navigation requirements while preventing costly redesigns.
What are the main benefits of user-focused mapping?
User-focused mapping delivers improved task completion rates, reduced user errors, higher user satisfaction, and better business outcomes. These benefits stem from intuitive and well-designed mapping interfaces that prioritize user needs, establish clear visual hierarchy, reduce cognitive load, ensure consistency, and enhance accessibility for users with varying abilities.