7 Best Typography Design Tips
Typography can make or break your map design – and most designers don’t realize how much power lies in their font choices. The right typographic approach transforms confusing geographical data into clear, navigable visual stories that guide users exactly where they need to go. Smart typography decisions help your maps communicate hierarchy, improve readability, and create the kind of user experience that keeps people engaged with your geographic content.
Disclosure: As an Amazon Associate, this site earns from qualifying purchases. Thank you!
Establish Clear Hierarchy With Size and Weight Variations
Visual hierarchy in map typography guides your reader’s eye through geographic information in order of importance. Size and weight variations create an intuitive reading pattern that prevents cognitive overload while ensuring critical information receives appropriate attention.
Use Larger Fonts for Major Geographic Features
Major geographic features like oceans, mountain ranges, and countries require larger font sizes to establish their dominance in your map’s visual hierarchy. Scale your text between 14-24 points for these primary elements, ensuring they remain readable at your intended viewing distance. This sizing approach immediately communicates the relative importance of continental features versus local landmarks, creating a natural reading flow that mirrors real-world geographic significance.
P.S. check out Udemy’s GIS, Mapping & Remote Sensing courses on sale here…
Apply Bold Weights for Primary Cities and Landmarks
Bold font weights effectively distinguish capital cities, major metropolitan areas, and significant landmarks from secondary locations on your map. Use medium to bold weights (600-700 font weight) for primary cities while reserving regular weights for smaller towns and villages. This weight differentiation creates instant recognition of urban hierarchies, helping users quickly identify major population centers and navigate between different scales of geographic importance.
Create Visual Flow With Graduated Text Sizes
Graduated text sizing establishes smooth transitions between different levels of geographic information, preventing jarring visual jumps that disrupt map readability. Design your type scale with consistent mathematical relationships—typically 1.2 to 1.5 ratios between hierarchy levels. Start with your largest features at 20+ points, scale down to 16 points for secondary elements, then 12 points for tertiary information, ensuring each level maintains clear distinction while preserving overall visual harmony.
Implement Strategic Color Coding for Different Map Elements
Color coding creates intuitive navigation pathways that complement your typographic hierarchy. Strategic color application transforms complex geographic information into instantly recognizable visual patterns.
Assign Distinct Colors to Political Boundaries
Use red tones for international borders to establish immediate recognition of sovereign territories. State and provincial boundaries work effectively in darker blue or purple shades that contrast with country borders. County and municipal divisions require lighter gray tones to avoid overwhelming primary political features. Administrative boundaries need consistent color weight relationships—international boundaries should always appear more prominent than regional divisions through both color intensity and line weight.
Use Contrasting Hues for Water Bodies and Terrain Features
Apply blue color families for all water elements while varying saturation levels based on water body size and importance. Oceans require deep navy blues while rivers and lakes use medium blue tones. Terrain features demand earth-tone palettes—browns for mountains, greens for forests, and tans for desert regions. Elevation changes benefit from graduated color schemes that transition smoothly from dark valley colors to lighter peak tones, creating natural depth perception.
Maintain Accessibility With High-Contrast Color Combinations
Ensure minimum 4.5:1 contrast ratios between text and background colors to meet WCAG accessibility standards. Test your color combinations using colorblindness simulators to verify readability across different visual conditions. Avoid problematic color pairs like red-green or blue-yellow combinations that create confusion for colorblind users. Supplement color coding with patterns, textures, or typography variations to provide multiple visual cues for distinguishing map elements effectively.
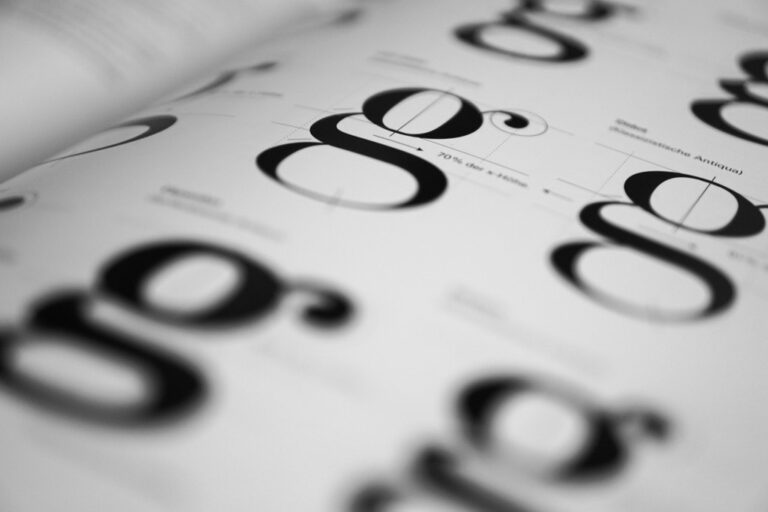
Choose Appropriate Typefaces for Enhanced Readability
Typeface selection forms the foundation of readable map typography, directly affecting how users process geographic information at various viewing distances and scales.
Achieve a flawless, even complexion with e.l.f. Flawless Satin Foundation. This lightweight, vegan formula provides medium coverage and a semi-matte finish for all-day wear, while hydrating your skin with glycerin.

Select Sans-Serif Fonts for Modern, Clean Appearance
Sans-serif fonts like Helvetica, Arial, and Open Sans deliver exceptional clarity for digital map interfaces and contemporary cartographic projects. These typefaces maintain sharp edges at small sizes, making them ideal for dense urban areas where multiple street names compete for space. Digital mapping platforms consistently favor sans-serif options because they render cleanly across different screen resolutions and devices. You’ll find these fonts particularly effective for road networks, administrative boundaries, and point-of-interest labels where modern aesthetics enhance user navigation.
Use Serif Fonts for Traditional or Historical Maps
Serif fonts such as Times New Roman, Minion Pro, and Trajan Pro provide the classical elegance essential for historical cartography and period-appropriate geographic representations. The serif details guide the eye naturally along text lines, improving readability for longer place names and descriptive labels common in vintage map styles. Traditional atlas production relies heavily on serif typography to maintain historical authenticity while ensuring geographic features remain distinguishable. These fonts work exceptionally well for antique reproductions, historical boundary demarcations, and scholarly geographic publications.
Avoid Decorative Fonts That Compromise Legibility
Decorative fonts like script, ornamental, or heavily stylized typefaces create significant readability barriers that undermine map functionality and user comprehension. These elaborate font choices become illegible when scaled down to typical map label sizes, particularly problematic for critical navigation information such as street names and landmark identifiers. Professional cartographic standards universally discourage decorative typography because it prioritizes aesthetics over essential geographic communication. Reserve decorative elements for map titles or legends where larger sizes maintain readability while adding visual interest.
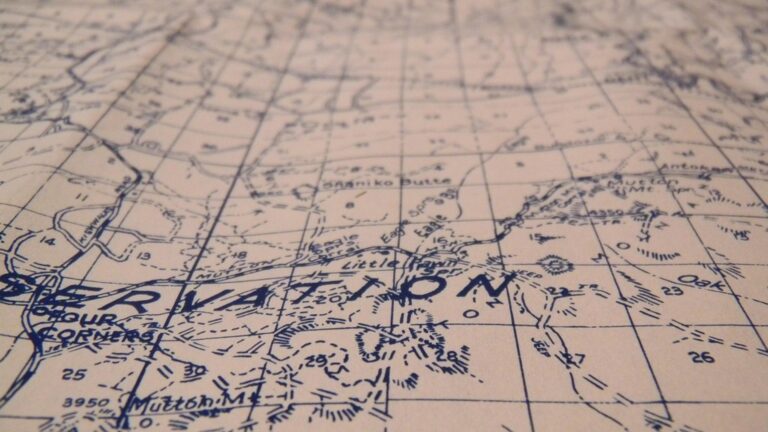
Position Text to Follow Natural Geographic Contours
Positioning text along natural geographic features creates intuitive label placement that mirrors the landscape’s flow. This approach enhances spatial understanding by connecting typography directly to terrain characteristics.
Align Labels Along Coastlines and Rivers
Follow the shoreline’s natural curve when labeling coastal features, ensuring text flows smoothly along the water’s edge. Place river names parallel to the waterway’s direction, adjusting letter spacing to accommodate meandering sections. Tools like ArcGIS Pro’s curved labeling engine automatically adjust text placement, while QGIS offers similar functionality through its label positioning algorithms. Maintain consistent text-to-feature distance of 2-3mm to prevent labels from overlapping water bodies or land masses.
Curve Text Around Circular Features Like Islands
Wrap island names around their perimeter using arc-based text placement, starting at the feature’s most prominent point. Position circular labels at approximately 70% of the island’s radius to ensure readability without crowding the coastline. Adobe Illustrator‘s “Type on a Path” tool excels for manual adjustments, while automated GIS labeling engines handle basic circular placement. Reserve this technique for islands larger than 15mm diameter at your map’s final scale to maintain legibility.
Learn Adobe Illustrator with the 2025 release of this comprehensive guide. Master essential skills through hands-on lessons.

Maintain Consistent Baseline Alignment for Readability
Establish uniform baseline spacing across all curved text elements to create visual harmony throughout your map. Set baseline offsets consistently—typically 1.5-2mm from the reference line—regardless of feature curvature. Use your mapping software’s baseline alignment controls to standardize vertical positioning across different geographic elements. This consistency prevents visual chaos when multiple curved labels appear in proximity, ensuring your typography enhances rather than competes with the underlying geographic information.
Utilize White Space and Spacing for Visual Clarity
Strategic white space application prevents visual clutter while maintaining professional cartographic standards. Proper spacing creates breathing room that allows readers to process geographic information without strain.
Provide Adequate Spacing Between Text Elements
Maintain minimum 2-3 pixel gaps between adjacent labels to prevent text collision and ensure readability across different zoom levels. You’ll want to establish consistent spacing rules that scale proportionally with your map’s resolution requirements.
Use automated spacing algorithms in GIS software like ArcGIS Pro or QGIS to calculate optimal distances between overlapping labels. These tools analyze text bounding boxes and apply minimum separation rules based on font size and display scale.
Test your spacing at various print sizes since what appears adequate on screen may create readability issues when printed at smaller scales or viewed on mobile devices.
Use Strategic Placement to Avoid Overcrowding
Position labels in natural gaps within your map’s geographic features rather than forcing text into dense areas where it competes for attention. Rivers, valleys, and open terrain provide ideal placement opportunities for clear label visibility.
Implement label hierarchies that prioritize essential geographic names while strategically omitting secondary labels in congested areas. You can use annotation classes to control which labels display at specific zoom levels or map scales.
Apply offset techniques to move labels away from point features while maintaining clear association through leader lines or proximity rules that preserve spatial relationships.
Balance Typography With Map Features for Clean Design
Coordinate text placement with underlying map symbology to create visual harmony between typographic elements and geographic features. Your labels should complement rather than compete with roads, boundaries, and terrain representations.
Use transparency settings on text backgrounds to maintain feature visibility while ensuring label readability. Semi-transparent halos or boxes around text prevent interference with underlying map details without completely obscuring geographic information.
Establish consistent margins around major map elements like legends, scale bars, and title blocks to create professional layouts that guide readers’ attention through your cartographic composition systematically.
Incorporate Consistent Capitalization and Formatting Rules
Consistent capitalization and formatting rules create visual order across your map’s typographic elements. These standardized approaches help users quickly identify different geographic categories while maintaining professional cartographic presentation.
Apply ALL CAPS for Countries and Major Regions
ALL CAPS formatting immediately signals the highest level of geographic importance on your map. You’ll want to reserve this treatment exclusively for sovereign nations like UNITED STATES, CANADA, and BRAZIL, along with major continental regions such as NORTH AMERICA or SOUTHEAST ASIA. This formatting creates clear geographic hierarchy while ensuring international boundaries remain visually prominent across different zoom levels and print scales.
Use Title Case for Cities and Towns
Title Case formatting provides optimal readability for urban settlements while maintaining appropriate visual weight. Apply this style to major cities like New York City, Los Angeles, and Chicago, as well as smaller municipalities such as Boulder, Aspen, and Park City. This approach creates consistency across your urban hierarchy while ensuring place names remain legible at various map scales without overwhelming other geographic features.
Implement Italics for Water Bodies and Natural Features
Italicized text effectively distinguishes hydrographic and topographic features from human settlements and political boundaries. Use this formatting for water bodies like Lake Superior, Mississippi River, and Pacific Ocean, along with natural landmarks such as Rocky Mountains, Grand Canyon, and Yellowstone National Park. The slanted letterforms create visual separation that helps users differentiate between natural and constructed geographic elements.
Design Scalable Typography for Multiple Zoom Levels
Effective map typography must adapt seamlessly across different zoom levels to maintain readability and visual hierarchy. This dynamic approach ensures your geographic labels remain functional whether users view continental overviews or neighborhood details.
Create Responsive Text That Adapts to Different Map Scales
Implement dynamic text sizing that automatically adjusts based on zoom level parameters. Set base font sizes at 1:1,000,000 scale and create multiplication factors for each zoom increment. For example, city labels might use 10pt at continental view and scale to 14pt at regional level. Configure your GIS software to trigger size changes at predetermined scale thresholds, typically doubling text size every 2-3 zoom levels to maintain proportional relationships with map features.
Maintain Legibility Across Various Display Sizes
Establish minimum font size thresholds that prevent text from becoming unreadable on smaller screens. Set 8pt as your absolute minimum for desktop displays and 12pt for mobile devices. Use relative sizing units like em or rem in web maps to ensure consistent scaling across different screen densities. Test your typography on various devices including tablets, smartphones, and high-resolution monitors to verify readability remains intact at all viewing conditions.
Experience vivid content on the Galaxy A16 5G's 6.7" display and capture stunning photos with its triple-lens camera. Enjoy peace of mind with a durable design, six years of updates, and Super Fast Charging.

Use Progressive Disclosure for Detailed Information
Layer information strategically by revealing additional details as users zoom closer to specific areas. Display only country names and major cities at continental scales, then progressively add state boundaries, smaller towns, and local landmarks at higher zoom levels. Create label priority rankings where essential geographic features appear first, followed by secondary information like neighborhood names and points of interest. This approach prevents visual clutter while ensuring relevant information appears when users need geographic context.
Conclusion
These seven typography techniques will transform your maps from simple navigation tools into powerful communication instruments. When you implement strategic font choices color coding and smart positioning you’ll create maps that users can read and understand effortlessly.
Remember that effective map typography isn’t about following every rule perfectly—it’s about finding the right balance for your specific project. Start with clear hierarchy and readable fonts then gradually incorporate advanced techniques like curved text and dynamic scaling as your skills develop.
Your typography choices directly impact how users interact with geographic information. By applying these functional approaches you’ll design maps that not only look professional but also serve their primary purpose: guiding people through space with clarity and confidence.
Frequently Asked Questions
What is the impact of typography on map design effectiveness?
Typography significantly influences how users interpret geographical information. The right font choices enhance clarity, readability, and user engagement by transforming complex data into accessible visual narratives. Poor typography can create barriers to navigation, while strategic font selection guides users effectively and improves overall map comprehension.
How do you establish visual hierarchy in map typography?
Use size and weight variations to create clear hierarchy. Apply larger fonts for major features like oceans and countries, bold weights for primary cities and landmarks, and graduated text sizes for smooth visual flow. This approach ensures different levels of geographic information are easily distinguishable while maintaining visual harmony.
What role does color coding play in map design?
Strategic color coding creates intuitive navigation pathways that complement typographic hierarchy. Use red tones for international borders, darker shades for state boundaries, and lighter grays for county divisions. Contrasting hues for water bodies and terrain features help transform complex geographic information into recognizable visual patterns.
Which typefaces work best for different map styles?
Sans-serif fonts like Helvetica and Arial provide clean, modern appearances ideal for digital maps and dense urban areas. Serif fonts such as Times New Roman work well for traditional or historical maps, offering elegance and improved readability for longer place names. Avoid decorative fonts that compromise legibility.
How should text be positioned on maps for optimal readability?
Align text along natural geographic contours like coastlines and rivers to create intuitive label placements. Curve text around circular features like islands while maintaining readability. Use consistent baseline alignment for curved elements to create visual harmony and prevent confusion when multiple labels are present.
What spacing guidelines ensure map text clarity?
Maintain minimum 2-3 pixel gaps between adjacent labels to prevent text collision across different zoom levels. Use automated spacing algorithms in GIS software for optimal label distances. Place labels strategically in natural gaps within geographic features and implement label hierarchies to prioritize essential names.
What capitalization rules should be followed in map typography?
Use ALL CAPS for countries and major regions to signal importance, Title Case for cities and towns to enhance readability, and italics for water bodies and natural features to distinguish them from human settlements. These consistent formatting rules create visual order and maintain clear geographic hierarchy.
How can typography be made scalable across different zoom levels?
Implement dynamic text sizing that adjusts based on zoom parameters with specific minimum font sizes for various devices. Use progressive disclosure to layer information, revealing details as users zoom in. This prevents visual clutter while ensuring relevant geographic context remains available at appropriate scales.