7 Ways to Deal with Conflicting Data Sources in Mapping That Pros Use
Why it matters: When you’re working with mapping projects you’ll inevitably hit a wall where different data sources contradict each other—and making the wrong choice can derail your entire analysis.
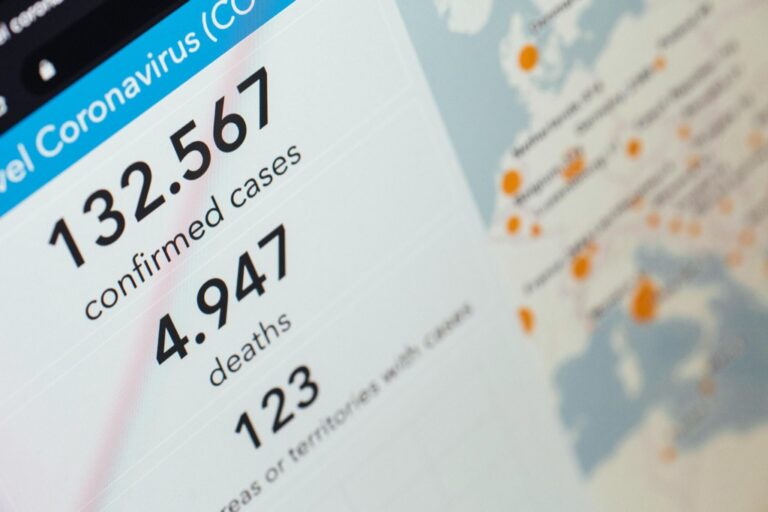
The reality: Geographic data conflicts happen more often than you’d expect with sources showing different boundaries population numbers or feature locations that simply don’t match up.
What’s ahead: We’ve identified seven proven strategies that help you navigate these data discrepancies and create reliable maps that stakeholders can trust.
Disclosure: As an Amazon Associate, this site earns from qualifying purchases. Thank you!
P.S. check out Udemy’s GIS, Mapping & Remote Sensing courses on sale here…
Establish Data Source Hierarchy and Prioritization
Creating a clear hierarchy prevents decision paralysis when multiple datasets conflict during your mapping workflow.
Rank Sources by Reliability and Authority
Government agencies typically provide the most authoritative geospatial data for administrative boundaries and census information. Federal sources like USGS, Census Bureau, and NOAA offer rigorously maintained datasets with documented accuracy standards. State and local agencies follow as secondary sources, while commercial providers rank third unless they specialize in specific geographic domains. Academic institutions and crowd-sourced platforms like OpenStreetMap occupy the fourth tier, though they may excel in niche applications or rapidly changing urban environments.
Create Decision Trees for Source Selection
Decision trees streamline your source selection process by establishing clear criteria for data conflicts. Start with temporal factors—prioritize the most recent data unless historical accuracy matters more. Next, evaluate spatial resolution and scale appropriateness for your project requirements. Consider data collection methodology, favoring ground-truthed surveys over remotely sensed estimates when precision matters. Finally, assess update frequency and maintenance schedules, choosing sources with regular revision cycles over static datasets for dynamic mapping applications.
Document Your Prioritization Criteria
Written documentation ensures consistent decision-making across team members and future project phases. Record your hierarchy rationale, including specific accuracy requirements, acceptable error tolerances, and update frequency needs. Note any project-specific factors like regulatory compliance or stakeholder preferences that influence source selection. Include version numbers, acquisition dates, and processing methods for each dataset. This documentation becomes invaluable for quality control audits and helps justify mapping decisions to clients or regulatory bodies.
Implement Cross-Validation Techniques
Cross-validation provides the analytical foundation for resolving conflicting data sources in your mapping projects. You’ll establish confidence levels for competing datasets through systematic comparison methods.
Achieve a flawless, even complexion with e.l.f. Flawless Satin Foundation. This lightweight, vegan formula provides medium coverage and a semi-matte finish for all-day wear, while hydrating your skin with glycerin.

Use Statistical Comparison Methods
Statistical comparison methods quantify differences between conflicting datasets through correlation analysis and root mean square error calculations. You can apply Pearson correlation coefficients to measure linear relationships between elevation models or population datasets. Chi-square tests help evaluate categorical data discrepancies like land use classifications across sources. Tools like R’s spatial statistics packages or ArcGIS’s Spatial Statistics toolbox automate these calculations, providing confidence intervals that guide your source selection decisions.
Apply Geometric Accuracy Testing
Geometric accuracy testing measures positional precision through ground control point validation and coordinate comparison analysis. You’ll establish reference points using GPS surveys or high-accuracy imagery to test feature location discrepancies. Calculate horizontal and vertical accuracy using RMSE formulas comparing your datasets against known control points. QGIS’s Georeferencer tool and ArcGIS’s Spatial Adjustment toolbar provide built-in accuracy assessment functions that generate detailed error reports for your validation documentation.
Verify Temporal Consistency Across Sources
Temporal consistency verification identifies time-based data conflicts through chronological analysis and change detection methods. You’ll compare acquisition dates, update frequencies, and temporal metadata across your conflicting sources to understand discrepancies. Use change detection algorithms in ENVI or ERDAS IMAGINE to analyze multi-temporal datasets systematically. Document temporal gaps between sources and apply interpolation techniques when necessary, ensuring your final mapping products reflect appropriate time periods for your project requirements.
Develop Standardized Data Integration Protocols
Standardized protocols ensure consistency when merging conflicting datasets into unified mapping products. These frameworks eliminate guesswork and create repeatable workflows for handling data discrepancies.
Create Universal Coordinate Reference Systems
Transform all datasets into a single coordinate reference system before integration begins. Choose systems appropriate for your project area – UTM zones for regional mapping or State Plane Coordinate Systems for local projects. EPSG codes provide standardized references for coordinate transformations using tools like GDAL or ArcGIS Project tools. Document your chosen CRS and transformation parameters to maintain spatial accuracy across all data sources throughout the mapping workflow.
Establish Common Attribute Standards
Define standardized field names, data types, and coding schemes before merging datasets. Create attribute mapping tables that translate different naming conventions into unified standards – for example, converting “Pop_2020,” “Population_2020,” and “Pop2020” fields into a single “Population” attribute. Use domain validation rules to ensure consistent categorical values and establish null value handling procedures. Document these standards in a data dictionary for team reference and quality control.
Build Automated Quality Control Checks
Implement automated validation scripts that flag inconsistencies during data integration processes. Use topology rules in ArcGIS or PostGIS constraints to identify geometric conflicts like overlapping polygons or gaps between adjacent features. Set tolerance thresholds for attribute comparisons and coordinate precision checks using tools like FME or custom Python scripts. Configure automated reports that highlight conflicts requiring manual review before final map production.
Utilize Conflict Detection and Flagging Systems
Modern mapping workflows require robust systems that automatically identify and flag data inconsistencies before they compromise your final products.
Set Up Automated Discrepancy Alerts
Configure automated alerts to catch conflicting data points during the ingestion process. You’ll want to establish threshold parameters for acceptable variance between datasets—typically 5-10% for attribute values and 1-2 meters for spatial features. Tools like ArcGIS Data Reviewer or FME Data Inspector can trigger email notifications when discrepancies exceed your predefined limits. Set up alerts for missing attributes, duplicate geometries, and coordinate system mismatches to catch problems early in your workflow.
Create Visual Conflict Identification Tools
Build visual dashboards that highlight conflicting data sources through color-coded overlays and symbol differentiation. You can use QGIS’s symbology engine or ArcGIS Pro’s visualization tools to display competing datasets with distinct transparency levels and contrasting colors. Create split-screen comparisons showing before-and-after views of conflicting features. Heat maps effectively show density differences between datasets, while side-by-side attribute tables reveal discrepancies in tabular data that might otherwise go unnoticed.
Implement Threshold-Based Warning Systems
Deploy threshold-based systems that automatically flag data when conflicts exceed acceptable parameters for your project requirements. You’ll need to define specific tolerance levels—such as 15% variance for population data or 3-meter positional accuracy for infrastructure features. Configure your GIS software to generate warning reports when datasets fall outside these parameters. Use statistical measures like standard deviation and confidence intervals to establish meaningful thresholds that balance data quality with practical project constraints.
Apply Weighted Averaging for Numerical Conflicts
Weighted averaging provides a mathematical solution when multiple data sources report different numerical values for the same geographic features. This approach combines conflicting measurements by assigning importance weights based on source reliability and data quality factors.
Calculate Confidence-Based Weights
Confidence-based weighting assigns numerical values to data sources based on their reliability and accuracy track record. You’ll establish weights ranging from 0.1 to 1.0 for each source, with government agencies typically receiving weights of 0.8-1.0, commercial providers 0.6-0.8, and crowd-sourced data 0.2-0.5. Calculate the weighted average by multiplying each conflicting value by its confidence weight, then dividing by the sum of all weights. Document your weighting criteria to ensure consistent application across similar datasets throughout your mapping project.
Use Distance-Weighted Interpolation
Distance-weighted interpolation applies inverse distance weighting to resolve spatial conflicts between nearby measurements. You’ll assign higher weights to data points closer to your target location, using the formula weight = 1/distance^p, where p typically equals 2. ArcGIS Spatial Analyst and QGIS provide built-in IDW tools for automated calculations. This method works particularly well for continuous variables like elevation, temperature, or population density where proximity indicates higher relevance. Apply distance buffers to limit the influence of outlying data points that might skew your results.
Implement Temporal Decay Factors
Temporal decay factors reduce the influence of older data sources when calculating weighted averages for time-sensitive datasets. You’ll apply exponential decay functions where data loses weight over time, typically using a half-life approach where data from one year ago receives 50% weight compared to current data. Set decay rates based on your data’s volatility – use aggressive decay (6-month half-life) for rapidly changing features like construction sites, and gentle decay (5-year half-life) for stable features like road networks. Tools like R or Python pandas enable automated temporal weighting calculations across large datasets.
Create Transparent Documentation and Metadata
Documentation serves as your project’s safety net when stakeholders question mapping decisions. Comprehensive metadata ensures reproducibility and builds trust in your final products.
Record All Source Decisions and Rationales
Document every data source choice with specific reasoning to justify your mapping decisions. Create decision logs that capture why you selected one dataset over another, including factors like spatial accuracy, temporal relevance, and source authority. Record the exact criteria you used, such as “Selected USGS boundaries over local municipality data due to 1:24,000 scale accuracy vs. 1:100,000.” Maintain these records in searchable formats like Excel spreadsheets or database tables with columns for source name, selection rationale, rejection reasons for alternatives, and decision date.
Maintain Detailed Lineage Information
Track complete data transformation workflows from original sources to final products. Document every processing step including coordinate transformations, attribute modifications, geometric corrections, and quality control procedures. Record software versions, parameter settings, and processing dates to ensure reproducibility. Create lineage diagrams that visually represent data flow through your workflow, showing inputs, processes, and outputs. Store this information in FGDC-compliant metadata formats or ISO 19115 standards to meet professional documentation requirements.
Establish Version Control Systems
Implement systematic versioning for all datasets and processing scripts throughout your project lifecycle. Use semantic versioning (1.0, 1.1, 2.0) to track major changes, minor updates, and patches to your data and methodologies. Store previous versions in organized folder structures with clear naming conventions like “ProjectName_v1.2_20240315.” Maintain change logs that document what modifications occurred between versions, who made them, and why. Consider using Git repositories for script versioning or geodatabase archiving tools for spatial data version management.
Engage Subject Matter Experts for Resolution
When automated processes and statistical analysis can’t resolve data conflicts, leveraging human expertise becomes your most valuable asset. Subject matter experts bring contextual knowledge that transforms conflicting datasets into accurate mapping decisions.
Consult Domain-Specific Specialists
Reach out to specialists who understand your mapping domain’s unique characteristics and data challenges. Environmental scientists can clarify wetland boundary discrepancies, while urban planners provide insights into zoning conflicts between municipal datasets. Transportation engineers help resolve road classification differences, and hydrologists explain stream network inconsistencies. Document their expertise by recording credentials, years of experience, and specific knowledge areas. Schedule structured interviews focusing on specific conflict areas rather than general discussions, ensuring you’ll receive actionable guidance for your mapping decisions.
Conduct Field Verification When Possible
Plan targeted field visits to verify conflicting data points through direct observation and measurement. Use GPS units with sub-meter accuracy to confirm feature locations, and photograph disputed areas from multiple angles for documentation. Coordinate with local officials such as county surveyors or municipal engineers who possess ground-truth knowledge of recent changes. Time your visits strategically around seasonal variations that might explain data discrepancies, like seasonal water levels or construction activities. Create field verification protocols that standardize data collection methods, ensuring consistent documentation across team members and maintaining quality control standards.
Stay connected anywhere with this compact satellite communicator. Enjoy two-way messaging, interactive SOS, and TracBack routing for confident navigation. Battery lasts up to 14 days in tracking mode.

Build Expert Review Committees
Assemble interdisciplinary panels comprising 3-5 experts from relevant fields who can collectively evaluate complex data conflicts. Include representatives from government agencies, academic institutions, and private sector organizations with complementary expertise areas. Establish clear review protocols that define voting procedures, conflict resolution methods, and documentation requirements for committee decisions. Schedule regular review meetings with structured agendas focusing on specific datasets or geographic areas rather than broad discussions. Document all committee decisions with detailed rationales, vote tallies, and minority opinions to maintain transparency and support future mapping decisions.
Conclusion
Managing conflicting data sources doesn’t have to derail your mapping projects. With the right combination of systematic prioritization automated detection tools and expert consultation you’ll transform data conflicts from roadblocks into opportunities for creating more accurate maps.
Remember that transparency is your greatest asset. Document every decision track your methodologies and maintain clear version control. This approach not only builds stakeholder confidence but also creates a roadmap for future projects.
The key lies in preparation and process. Establish your protocols before conflicts arise implement robust quality control measures and don’t hesitate to seek expert guidance when automated solutions fall short. Your commitment to addressing data discrepancies systematically will set your mapping projects apart and deliver the reliable results your stakeholders demand.
Frequently Asked Questions
What are data conflicts in mapping projects?
Data conflicts occur when different data sources provide contradictory information about the same geographic features, such as varying boundaries, population figures, or feature locations. These discrepancies can significantly compromise the accuracy and reliability of mapping analyses if not properly addressed during the project workflow.
How do you establish a data source hierarchy for mapping?
Create a ranking system based on reliability and authority. Government agencies typically rank highest, followed by state and local agencies, commercial providers, and crowd-sourced platforms. Consider factors like data recency, spatial resolution, collection methodology, and update frequency when establishing your hierarchy.
What is cross-validation in mapping data conflicts?
Cross-validation involves systematically comparing competing datasets to establish confidence levels. This process uses statistical methods like Pearson correlation coefficients and chi-square tests to quantify differences between datasets, helping determine which sources are most reliable for your specific mapping needs.
How can automated conflict detection help mapping projects?
Automated systems identify data inconsistencies before they compromise final products. These tools set threshold parameters for acceptable variance, trigger alerts for discrepancies exceeding limits, and create visual dashboards with color-coded overlays to highlight conflicting data sources during the integration process.
What is weighted averaging for resolving data conflicts?
Weighted averaging combines conflicting measurements by assigning importance weights based on source reliability and data quality. Government sources typically receive higher weights, while proximity and temporal factors can also influence the weighting scheme to produce more accurate final results.
Why is documentation important in mapping conflict resolution?
Comprehensive documentation builds trust and ensures reproducibility. It includes recording source decisions, maintaining data lineage information, establishing version control systems, and documenting rationales behind data selections. This transparency helps justify mapping decisions to clients and regulatory bodies.
When should you consult subject matter experts for data conflicts?
Engage experts when automated processes and statistical analysis cannot resolve conflicts. Domain specialists like environmental scientists or urban planners can provide unique insights into data challenges. Field verification and expert review committees are particularly valuable for complex conflicts.
How do you verify temporal consistency in mapping data?
Analyze acquisition dates across all data sources and apply change detection methods to ensure datasets represent the required time periods. Implement temporal decay factors that reduce the influence of older data in time-sensitive projects using exponential decay functions.