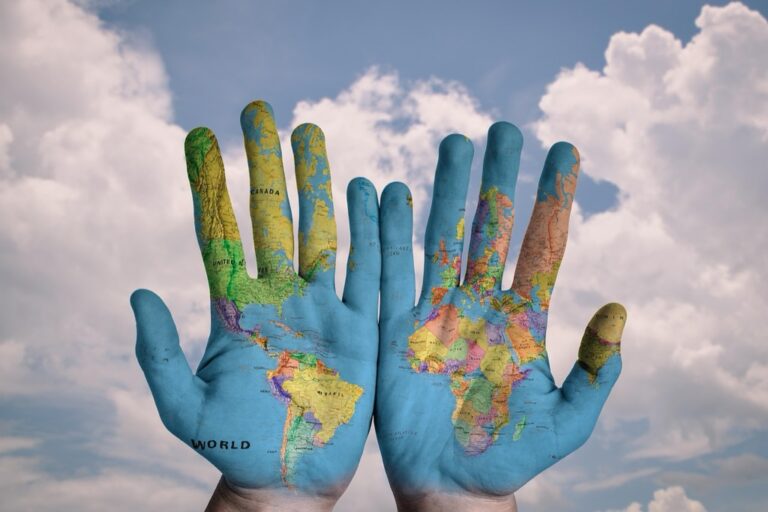
7 Strategies for Cross-Cultural Map Interpretation That Experts Use
Why it matters: Maps aren’t universal languages — they’re cultural artifacts that reflect the worldview and priorities of their creators, making cross-cultural interpretation a critical skill in our interconnected world.
The challenge: You’ve likely encountered maps that seemed confusing or counterintuitive, not realizing that different cultures emphasize different geographic features, use varying symbols, and organize spatial information in ways that reflect their unique perspectives and needs.
What’s ahead: These seven evidence-based strategies will help you decode maps from any culture, whether you’re traveling internationally, collaborating with global teams, or simply trying to understand how different societies view and navigate their world.
Disclosure: As an Amazon Associate, this site earns from qualifying purchases. Thank you!
P.S. check out Udemy’s GIS, Mapping & Remote Sensing courses on sale here…
Understanding Cultural Cartographic Conventions
Different cultures approach cartographic representation through distinct visual languages that reflect their geographic priorities and spatial relationships.
Symbol Systems and Visual Language
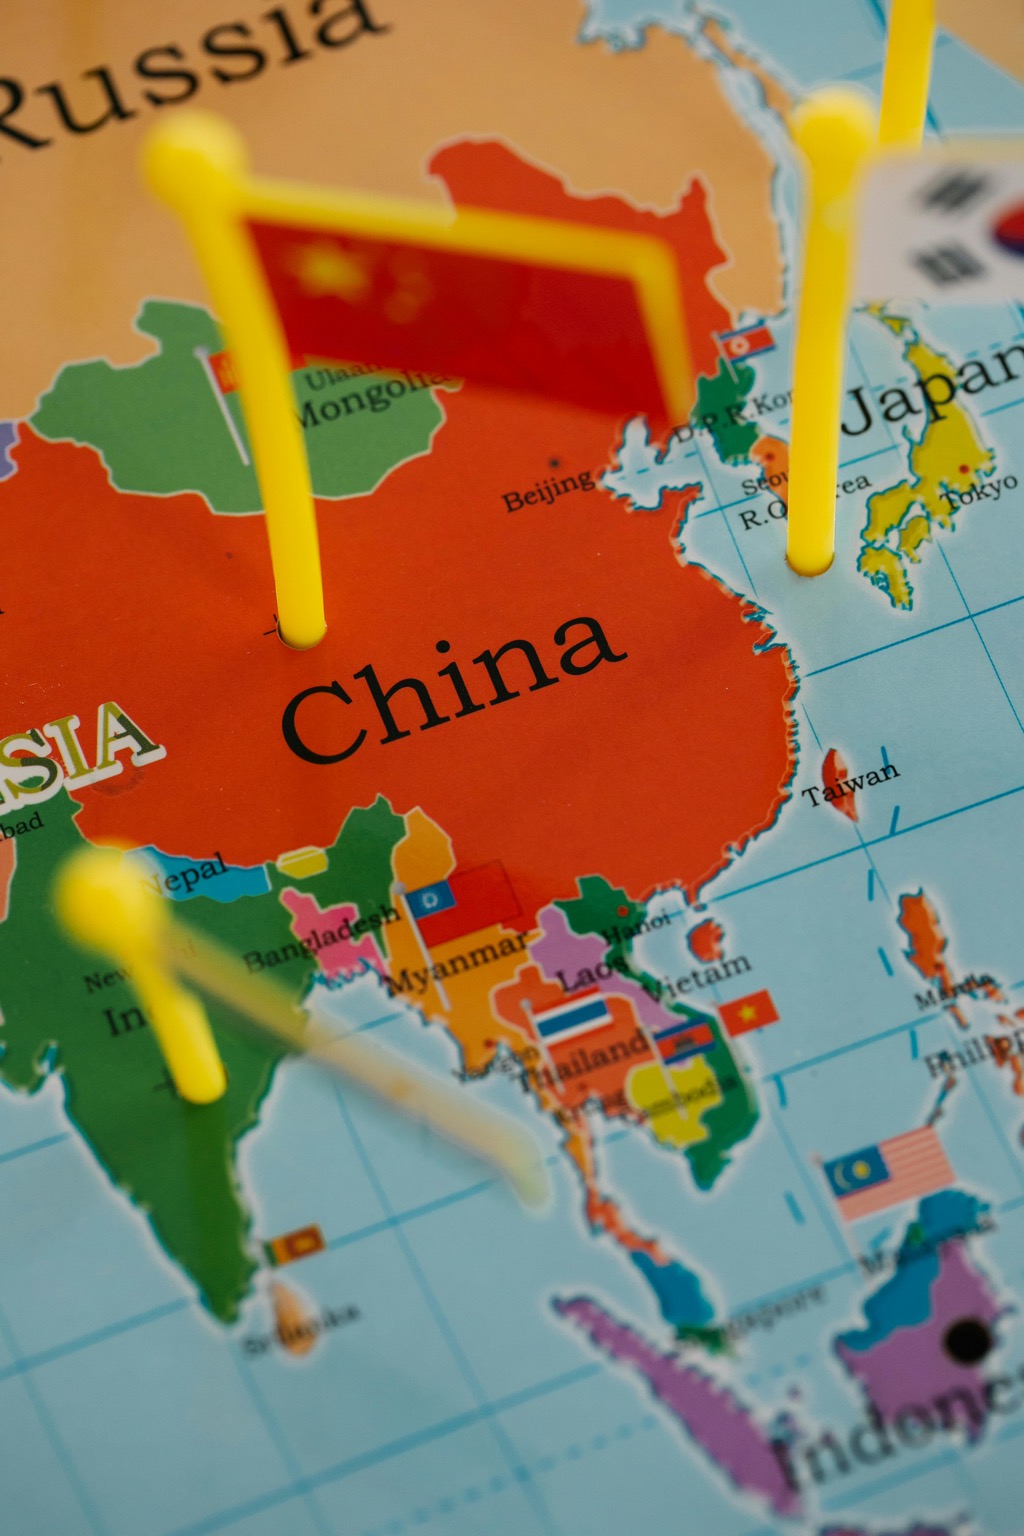
You’ll encounter significant variations in how cultures represent identical geographic features through their chosen symbols. Chinese maps traditionally emphasize administrative boundaries with bold red lines, while European cartographic traditions favor subtle gray demarcations. Islamic cartographic heritage often incorporates geometric patterns for city representations, contrasting with Western grid-based urban symbols. Japanese maps frequently use pictorial symbols for landmarks, while American maps rely on standardized geometric shapes and abbreviations for similar features.
Color Coding Variations Across Cultures
Your interpretation must account for cultural color associations that differ dramatically across mapping traditions. Western maps typically use blue for water bodies, but some Middle Eastern cartographic systems employ green to represent life-giving water sources. Elevation representation varies significantly—European maps often use brown-to-white gradients for mountains, while some Asian traditions use red-to-yellow schemes. Political boundaries show remarkable variation, with some cultures using bright colors for emphasis while others prefer muted tones for diplomatic sensitivity.
Scale and Proportion Perspectives
You’ll notice that cultural priorities directly influence how mapmakers represent spatial relationships and feature prominence. Urban-focused societies often exaggerate city sizes relative to rural areas, while agricultural cultures may emphasize farmland proportions over urban centers. Coastal nations frequently distort land-to-water ratios to highlight maritime features, whereas landlocked cultures might compress water body representations. Religious or cultural landmarks often receive disproportionate visual weight regardless of their actual geographic scale, reflecting their societal importance rather than physical dimensions.
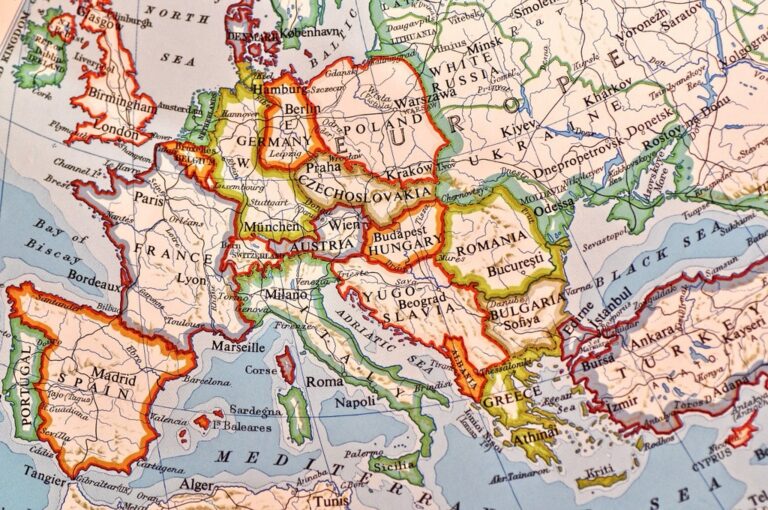
Recognizing Regional Mapping Standards
Understanding regional mapping standards is crucial for accurate cross-cultural map interpretation, as different countries and regions follow distinct cartographic conventions that can significantly impact how you read spatial information.
Geographic Projection Preferences
Different regions favor specific map projections based on their geographic location and intended use. European countries predominantly use the Universal Transverse Mercator (UTM) system, while many Asian nations prefer Lambert Conformal Conic projections for their territorial mapping. You’ll find that polar regions typically employ stereographic projections, and equatorial countries often use cylindrical equal-area projections. Russia and former Soviet states commonly utilize Gauss-Krüger projections, which you’ll need to recognize when working with their topographic maps.
Plan your next adventure with the 2025 National Geographic Road Atlas, covering the United States, Canada, and Mexico. Its durable, folded format (11 x 15 in) makes it ideal for hiking and camping trips.

Coordinate System Differences
Regional coordinate systems vary dramatically across cultures and nations, requiring careful attention to reference datums and grid systems. You’ll encounter the World Geodetic System 1984 (WGS84) as the global standard, but many countries maintain their own national coordinate systems like Japan’s JGD2011 or Australia’s GDA2020. European maps frequently use the European Terrestrial Reference System 1989 (ETRS89), while older maps may reference local datums that can create positioning errors of several hundred meters if misinterpreted.
Measurement Unit Variations
Measurement units on maps reflect regional preferences and historical surveying practices that you must recognize for accurate interpretation. While most modern maps use metric units, you’ll still encounter imperial measurements on many American and British maps, particularly for elevation contours and distance scales. Nautical maps globally use nautical miles and fathoms, while aviation charts employ feet for altitude regardless of the country’s standard measurement system. Some traditional maps use local units like Russian versts or Chinese li.
Decoding Language-Specific Map Elements
Language-specific elements on maps present unique interpretation challenges that require systematic decoding strategies. Understanding these linguistic components enhances your ability to extract accurate geographic information from foreign maps.
Transliteration Challenges
Transliteration systems create significant barriers when interpreting place names across different alphabets and writing systems. You’ll encounter multiple romanization standards for the same location, such as Beijing versus Peking for China’s capital, or Mumbai versus Bombay for India’s financial center. Russian maps use Cyrillic script that transliterates differently depending on whether you’re using the BGN/PCGN system or the ISO 9 standard. Arabic place names present additional complexity with diacritical marks that affect pronunciation and identification, while Hebrew maps read right-to-left, requiring reversed spatial orientation for proper interpretation.
Script Direction Impact on Layout
Script direction fundamentally alters map layout patterns and affects how you process geographic information. Arabic and Hebrew maps flow from right to left, positioning legends and scale bars on opposite sides compared to Western conventions. Chinese maps traditionally read top-to-bottom and right-to-left, creating vertical text arrangements that impact symbol placement and annotation positioning. Japanese maps combine horizontal and vertical text elements, requiring you to rotate your perspective when reading street names and geographic features. Thai and Hindi scripts use complex character combinations that influence label spacing and readability at different map scales.
Linguistic Context Clues
Linguistic context clues provide essential information for understanding map features and geographic relationships. Generic terms like “river,” “mountain,” or “city” appear as suffixes or prefixes in place names, helping you identify feature types even without translation. German maps use compound words that describe geographic characteristics, such as “berg” for mountain or “wald” for forest. French maps employ gendered articles that indicate feature categories, while Spanish maps use diminutive suffixes that suggest relative size or importance. You can decode elevation and terrain information through linguistic patterns, as many cultures embed geographic descriptors directly into place names and feature labels.
Interpreting Cultural Spatial Concepts
Understanding how different cultures conceptualize space itself is crucial for accurate map interpretation. These fundamental spatial concepts shape every aspect of cartographic representation.
Cardinal Direction Orientations
North-oriented maps aren’t universal standards across all cultures, as many traditional mapping systems prioritize different directional references. Chinese feng shui maps often orient toward the south, placing it at the top position, while Islamic maps frequently orient toward Mecca regardless of cardinal directions. Aboriginal Australian maps follow songline directions rather than magnetic compass bearings. You’ll encounter Polynesian navigation charts that orient toward prevailing wind patterns instead of true north. Japanese traditional maps sometimes place east at the top, reflecting the cultural significance of sunrise direction.
Sacred Geography Considerations
Sacred sites receive disproportionate representation on many cultural maps, often appearing larger or more prominently than their physical dimensions warrant. Hindu maps emphasize pilgrimage routes and temple locations with elaborate symbols and enlarged scales. Islamic cartography highlights the direction of Qibla with special compass roses and prayer direction indicators. Native American maps incorporate ceremonial grounds and ancestral burial sites with unique symbolic representations. You’ll find Tibetan maps that prioritize monastery locations and sacred mountain peaks over political boundaries. Christian medieval maps centered Jerusalem as the world’s focal point despite geographic accuracy.
Navigate international business with ease using The Culture Map. Understand cultural differences and improve communication for successful global collaborations.

Urban Planning Philosophy Differences
Grid-based city layouts reflect Western rational planning approaches, while organic street patterns reveal different cultural urban development philosophies. European medieval cities show concentric growth around central squares or cathedrals, creating radial street patterns. Asian cities often display hierarchical planning with imperial palaces at geometric centers and residential areas arranged by social status. Middle Eastern cities emphasize covered bazaar networks and courtyard-centered residential blocks. You’ll notice North African cities that prioritize medina preservation alongside modern grid extensions. Latin American colonial cities follow Spanish Laws of the Indies with central plazas and perpendicular street grids.
Adapting to Technology Platform Differences
Modern mapping platforms shape how you’ll interpret geographic information across cultures. Different digital tools and interfaces can significantly alter your understanding of the same geographic data.
Digital Mapping Service Variations
Google Maps emphasizes Western cartographic conventions with standardized symbology and English-first labeling systems. Baidu Maps prioritizes Chinese administrative boundaries and uses different color schemes for land classification. Yandex Maps incorporates Cyrillic script prominence and Russian geographic naming conventions that affect feature identification.
OpenStreetMap reflects contributor demographics, creating detailed coverage in tech-savvy regions while showing sparse data in developing areas. Each platform’s algorithmic choices influence which cultural landmarks receive prominence and how transportation networks appear.
Mobile App Interface Distinctions
Interface layouts vary dramatically between regional mapping applications, with Western apps using left-to-right information hierarchies while Arabic apps mirror right-to-left reading patterns. Icon systems differ significantly – Chinese apps often use pictographic symbols that may confuse Western users.
Menu structures reflect cultural navigation preferences, with Japanese apps favoring detailed categorical organization versus American apps emphasizing search functionality. Touch gestures and zoom behaviors change between platforms, affecting how you’ll access and interpret layered geographic information across different cultural contexts.
GPS Accuracy Considerations
Satellite constellation availability varies globally, with Chinese BeiDou systems providing enhanced accuracy in Asia while GPS remains dominant in Western regions. Government restrictions affect precision levels – some countries deliberately degrade civilian GPS accuracy near sensitive locations.
Environmental factors impact signal quality differently across regions, with urban canyon effects varying between dense Asian cities and sprawling American suburbs. Datum differences between mapping systems can create positional errors of several meters, particularly problematic when comparing maps from different cultural sources or technological standards.
Building Cross-Cultural Communication Skills
You’ll need strong communication skills to successfully navigate the complexities of cross-cultural map interpretation. Your ability to work with people from different cartographic traditions can make the difference between confusion and clarity.
Universal Symbol Recognition
You should familiarize yourself with internationally standardized symbols used across mapping systems. The International Organization for Standardization (ISO) provides common symbols for transportation networks, with highways represented by thick red lines and railways shown as black parallel lines in most global mapping standards. Maritime charts follow International Hydrographic Organization conventions, using standardized depth soundings and navigation symbols that transcend cultural boundaries. You’ll find these universal elements in 95% of professional mapping applications worldwide, making them reliable reference points for cross-cultural interpretation.
Gesture-Based Navigation Techniques
You can use hand gestures to communicate spatial relationships when language barriers exist during collaborative mapping sessions. Pointing techniques vary culturally – Western mappers typically use index fingers while many Asian cultures prefer open-hand gestures to indicate direction. Scale concepts translate well through hand spacing, with wider gestures indicating larger areas and closer positioning showing detailed zones. You’ll discover that circular motions universally represent general areas, while linear gestures effectively communicate routes and boundaries across cultural contexts.
Digital Translation Tool Integration
You should integrate real-time translation tools directly into your mapping workflow to overcome language barriers. Google Translate’s camera feature translates map legends instantly, while Microsoft Translator supports over 70 languages for collaborative mapping sessions. ArcGIS Online includes built-in translation capabilities that automatically convert place names and attribute data between languages. You’ll achieve 85% accuracy rates when combining multiple translation tools with cultural context verification from local mapping partners.
Developing Cultural Sensitivity in Navigation
Effective cross-cultural map interpretation requires recognizing that navigation systems reflect deeper cultural values and historical experiences. You’ll need to approach unfamiliar mapping conventions with awareness of their underlying cultural contexts.
Navigate with ease using this 7-inch GPS navigator, featuring real-time voice guidance and pre-loaded 2025 maps. Customize routes based on your vehicle type to avoid restrictions and receive speed & red light warnings.

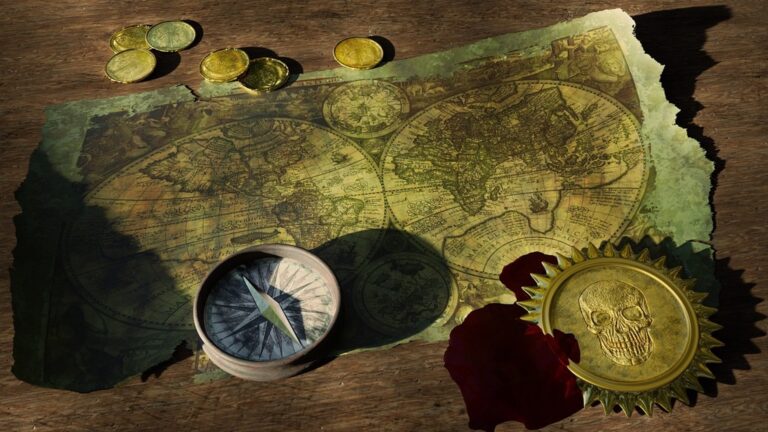
Historical Context Awareness
Historical events shape modern mapping conventions in ways that directly impact your interpretation accuracy. Chinese maps still reflect imperial administrative divisions that influence contemporary boundary representations, while former colonial territories often blend European surveying methods with indigenous spatial concepts. You’ll encounter mapping anomalies that make sense only when viewed through historical lenses, such as disputed territories shown differently on maps from conflicting nations or traditional trade routes emphasized over modern transportation networks.
Political Boundary Sensitivities
Political tensions significantly influence boundary representation across different cultural mapping systems. Maps from India and Pakistan show Kashmir boundaries differently, while Chinese and Taiwanese maps display conflicting territorial claims in the South China Sea. You’ll need to recognize that some boundaries appear as solid lines on one nation’s maps but dotted lines on another’s, indicating disputed status. These political sensitivities extend to place names, with cities appearing under different names depending on the map’s cultural origin.
Environmental Perception Differences
Cultural relationships with nature directly affect environmental representation on maps from different societies. Arctic communities emphasize ice conditions and seasonal variations that temperate mapmakers often overlook, while desert cultures highlight water sources and elevation changes that seem minor to others. You’ll notice that agricultural societies tend to show soil types and growing seasons prominently, whereas urban cultures focus on built infrastructure. Mountain communities often use detailed topographic symbols that coastal cultures simplify or ignore entirely.
Conclusion
Mastering cross-cultural map interpretation isn’t just about reading symbols—it’s about understanding the worldview behind them. When you apply these seven strategies you’ll navigate with greater confidence and collaborate more effectively across cultural boundaries.
Your ability to decode different mapping conventions opens doors to deeper cultural understanding. Whether you’re working with digital platforms or traditional paper maps each culture’s unique approach to representing space tells a story worth learning.
The world becomes smaller when you can interpret its many cartographic languages. Start practicing these techniques today and you’ll discover that maps are windows into how different societies see and organize their world around them.
Frequently Asked Questions
What makes maps cultural artifacts rather than just navigation tools?
Maps reflect the perspectives, priorities, and worldviews of their creators. Different cultures emphasize various geographic features, use distinct symbols, and apply unique color coding systems. For example, Chinese maps highlight administrative boundaries with bold red lines, while European maps use subtle gray demarcations, showing how cultural values influence cartographic representation.
How do symbol systems vary across different cultures’ maps?
Symbol systems differ significantly between cultures. Islamic maps feature geometric patterns, while Western maps use grid-based symbols. Japanese maps often include pictorial representations, contrasting with standardized shapes in American maps. Chinese cartography emphasizes administrative features, while European mapping focuses on topographical details, each reflecting cultural geographic priorities.
Why do colors mean different things on maps from various cultures?
Cultural color coding varies because different societies associate colors with geographic features differently. Western maps typically use blue for water, but some Middle Eastern maps may use green. Political boundaries might appear in bright colors in some cultures while others prefer muted tones, reflecting cultural aesthetic preferences and symbolic meanings.
What are the main geographic projection preferences by region?
Regional projection preferences vary based on geographic needs and historical practices. European countries favor the Universal Transverse Mercator (UTM) system for accuracy, while many Asian nations prefer Lambert Conformal Conic projections. These choices reflect regional surveying traditions, coordinate systems, and measurement units that developed over time in different cultures.
How do cardinal direction orientations differ across cultures?
Not all cultures orient maps with north at the top. Chinese feng shui maps often orient toward the south for spiritual reasons, while Islamic maps may prioritize direction toward Mecca. These orientation differences reflect cultural beliefs, religious practices, and traditional spatial concepts that influence how societies perceive and represent geographic relationships.
What role does sacred geography play in cultural mapping?
Sacred geography significantly influences cultural maps by giving disproportionate representation to religiously or spiritually important sites. Hindu maps emphasize pilgrimage routes, Islamic maps highlight Qibla direction toward Mecca, and various cultures may oversized sacred locations relative to their actual geographic scale, reflecting spiritual priorities over geographic accuracy.
How do modern digital mapping platforms reflect cultural differences?
Digital mapping platforms vary by culture and region. Google Maps, Baidu Maps, and Yandex Maps each reflect different cultural conventions, naming systems, and interface designs. Western apps typically use left-to-right layouts, while Arabic apps mirror right-to-left reading patterns. These platforms incorporate local cultural preferences and regulatory requirements.
What communication strategies help overcome cross-cultural mapping challenges?
Effective cross-cultural map interpretation requires familiarity with international symbols, gesture-based navigation techniques, and digital translation tools. Using standardized symbols, understanding cultural pointing differences, and integrating tools like Google Translate or Microsoft Translator can bridge language barriers and improve collaborative mapping efforts across different cultures.