
5 Best Mapping Techniques for Visualizing Boundaries
Why it matters: You’re dealing with disputed territories and need to visualize them clearly without taking political sides.
The big picture: Modern mapping tools let you create layered visualizations that present contested boundaries objectively while maintaining geographic accuracy.
What’s next: These five strategic approaches will help you display territorial disputes professionally and informatively.
Disclosure: As an Amazon Associate, this site earns from qualifying purchases. Thank you!
P.S. check out Udemy’s GIS, Mapping & Remote Sensing courses on sale here…
Use Color-Coded Overlays to Highlight Territorial Disputes
Color-coded overlays provide the most effective method for visualizing contested boundaries while maintaining cartographic neutrality. You’ll create clear visual distinctions that allow viewers to understand complex territorial situations without implying legitimacy of any particular claim.
Apply Contrasting Colors for Competing Claims
Assign distinct colors to each disputing party using high-contrast combinations like blue and orange or red and green. You’ll ensure maximum visual separation by selecting colors with opposite positions on the color wheel. Apply these colors consistently across all disputed areas to maintain clarity. Test your color choices against colorblind accessibility standards using tools like ColorBrewer to guarantee universal readability.
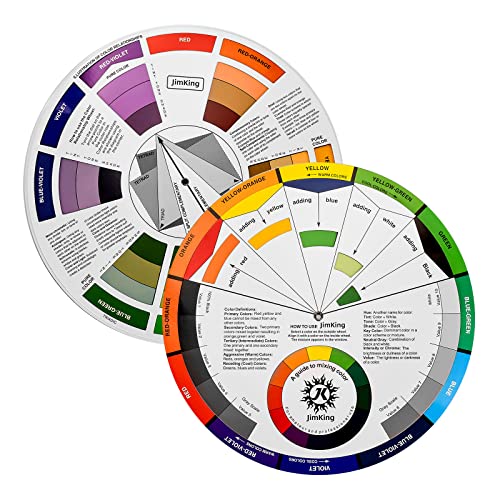
Easily organize and understand color relationships with this rotating color wheel. Ideal for artists and designers, it features a durable, UV-coated design for lasting use and clear color identification.
Easily organize and understand color relationships with this rotating color wheel. Ideal for artists and designers, it features a durable, UV-coated design for lasting use and clear color identification.
Implement Transparency Effects to Show Overlapping Areas
Set overlay transparency between 40-60% opacity to reveal underlying geographic features while maintaining color visibility. You’ll create compelling visualizations by layering semi-transparent polygons that show where multiple claims intersect. Use darker transparency levels for primary claims and lighter settings for secondary or historical boundaries. This technique allows base map details to remain visible while clearly delineating contested zones.
Create Visual Legends to Identify Disputing Parties
Design comprehensive legends that neutrally identify each party without political bias or hierarchical ordering. You’ll list disputing entities alphabetically or by geographic position to avoid implied preferences. Include clear color swatches, consistent symbology, and neutral descriptive text like “Area claimed by Entity A” rather than “Entity A’s territory.” Position legends prominently but ensure they don’t obscure critical geographic information.
Employ Hatching Patterns to Indicate Uncertain Boundaries
Hatching patterns provide cartographers with a versatile method to represent territorial ambiguity without implying resolution. These traditional yet effective techniques allow you to visualize contested areas while maintaining professional neutrality in your mapping projects.
Explore and map the wilderness for the Queen in Cartographers! Draw unique terrain shapes and score points based on randomly selected goals each game, but beware of monster ambushes.

Design Diagonal Lines for Disputed Regions
Create 45-degree diagonal lines across disputed territories to indicate active territorial conflicts. You’ll want to use consistent line weight (typically 0.5-1.0 points) and spacing (2-3mm intervals) throughout your map for visual coherence. Apply these patterns at 25-50% opacity to preserve underlying geographic features while clearly marking contested zones. Professional GIS software like ArcGIS Pro and QGIS offer customizable line pattern tools that automatically maintain uniform spacing and orientation across irregular boundary shapes.
Utilize Cross-Hatching for Multiple Competing Claims
Apply perpendicular line intersections where three or more parties claim the same territory. Cross-hatching at 45 and 135-degree angles creates distinct visual texture that immediately signals complex territorial disputes. You can vary line density (closer spacing for more intense disputes) and use different colors for each competing claim while maintaining the cross-hatch pattern. This technique proves especially effective for maritime boundaries where multiple nations assert overlapping exclusive economic zones or continental shelf claims.
Apply Dotted Patterns for Temporary or Provisional Borders
Use stippled or dotted fill patterns to represent boundaries under negotiation or temporary administrative divisions. Create dot patterns with 1-2 point circles spaced 3-4mm apart to indicate provisional status without suggesting permanence. You’ll find this approach particularly useful for depicting cease-fire lines military demarcation zones or boundaries established by international agreements pending final resolution. Professional mapping standards recommend 40-60% pattern density to ensure visibility while maintaining map readability across different print and digital formats.
Implement Gradient Shading to Represent Contested Zones
Gradient shading creates sophisticated visual representations of territorial uncertainty by transitioning smoothly between different administrative claims. This technique allows you to show contested areas without imposing definitive boundaries.
Use Smooth Color Transitions for Border Ambiguity
Apply gradual color transitions using tools like ArcGIS Pro’s symbology renderer or QGIS’s raster calculator to create seamless blends between competing territorial claims. Start with neutral base colors—light gray transitioning to cream—and gradually introduce claim-specific hues toward established borders. Set transparency levels between 60-80% to maintain underlying geographic detail visibility while clearly indicating disputed status through your gradient progression.
Apply Intensity Variations to Show Control Levels
Modify color saturation and brightness to represent different levels of administrative control within contested territories. Use high-intensity colors (90-100% saturation) for areas with strong governmental presence and reduce intensity to 30-50% for regions with limited control. Tools like ColorBrewer help you select appropriate color schemes that maintain accessibility standards while effectively communicating control variations through your intensity mapping approach.
Create Buffer Zone Representations with Gradient Techniques
Generate buffer zones around disputed boundaries using GIS proximity analysis tools, then apply graduated color schemes to represent decreasing certainty with distance from established borders. Create 5-10 kilometer buffer increments with color values that fade from opaque (80% transparency) at border edges to nearly transparent (20% opacity) at maximum buffer distances, effectively showing territorial influence gradients.
Deploy Multiple Boundary Lines to Show Different Perspectives
You’ll create comprehensive boundary representations by layering different line types to distinguish between various territorial claims and administrative realities.
Draw Solid Lines for Official Government Claims
Solid lines represent internationally recognized borders and official government positions. Use thick, continuous lines with 2-3 pixel width to display established diplomatic boundaries that appear on official state maps. Apply distinct colors like navy blue or dark red to differentiate between competing nations’ claims. These lines should maintain consistent styling throughout your map to establish visual hierarchy and clearly indicate which boundaries carry official governmental recognition versus other territorial assertions.
Add Dashed Lines for Historical Boundaries
Dashed lines effectively illustrate former territorial divisions and colonial-era borders. Implement 4-6 pixel dashes with 2-3 pixel spacing to show previous administrative boundaries that influence current disputes. Use muted colors like gray or brown to distinguish historical context from active claims. These patterns help viewers understand how past territorial arrangements contribute to present-day conflicts while maintaining visual separation from contemporary boundary assertions through consistent dash formatting.
Include Dotted Lines for De Facto Control Areas
Dotted lines accurately represent actual territorial control regardless of international recognition. Create small dots with 1-2 pixel diameter and equal spacing to indicate areas where military or administrative control differs from official claims. Apply contrasting colors such as orange or purple to separate de facto boundaries from diplomatic ones. This technique reveals the gap between legal sovereignty and practical governance in contested regions.
Integrate Interactive Toggle Layers for Dynamic Viewing
Interactive toggle layers transform static contested boundary maps into dynamic tools that accommodate multiple perspectives while maintaining cartographic objectivity.
Enable Users to Switch Between Different Territorial Claims
Toggle functionality allows viewers to examine competing territorial claims individually or in combination. You’ll implement radio button controls that display each disputing party’s claimed boundaries as separate layers. ArcGIS Online and Leaflet.js provide robust toggle controls for web-based maps. Create distinct layer groups for each claim using contrasting line weights and colors. This approach prevents visual clutter while ensuring users can analyze territorial disputes from multiple governmental perspectives without cartographic bias.
Provide Time-Based Layers for Historical Boundary Changes
Temporal layer controls reveal how contested boundaries evolved over decades or centuries. You’ll design slider controls that progress through historical boundary configurations using time-stamped datasets. QGIS TimeManager plugin and D3.js timeline widgets excel at managing chronological boundary data. Structure your temporal layers with standardized date ranges and consistent symbology. This functionality helps users understand current disputes within historical context while demonstrating how territorial claims developed through different political periods.
Offer Selective Visibility Controls for Complex Disputes
Checkbox controls enable users to display specific dispute elements like maritime zones, buffer areas, or administrative boundaries. You’ll create hierarchical layer menus that organize complex territorial information into manageable categories. OpenLayers and Mapbox GL JS support advanced layer visibility management with nested controls. Design intuitive groupings such as “Land Boundaries,” “Maritime Claims,” and “Historical Territories.” This selective approach prevents information overload while allowing detailed analysis of specific dispute components.
Conclusion
These five layering techniques give you powerful tools to visualize contested boundaries with professional neutrality and geographic accuracy. By combining color-coded overlays with interactive features you’ll create maps that inform rather than advocate.
Your choice of visual elements – from gradient shading to multiple boundary lines – determines how effectively your audience understands complex territorial disputes. Remember that transparency and clear legends help viewers navigate competing claims without confusion.
Modern mapping technology makes these sophisticated visualizations accessible to cartographers at every skill level. You can now transform static territorial data into dynamic tools that reveal the full complexity of boundary disputes while maintaining objectivity.
Frequently Asked Questions
What are the best color schemes for mapping disputed territories?
Use contrasting colors like blue and orange or red and green to clearly distinguish between competing territorial claims. Apply transparency effects to show overlapping areas while maintaining visibility of underlying geographic features. Create neutral visual legends that identify disputing parties without political bias, ensuring clarity and professional presentation.
How can hatching patterns help visualize territorial disputes?
Hatching patterns effectively indicate uncertain boundaries without implying resolution. Use diagonal lines for active conflicts, cross-hatching for multiple competing claims (especially maritime boundaries), and dotted patterns for temporary or provisional borders under negotiation. These techniques maintain map readability while clearly showing territorial ambiguity.
What is gradient shading and how does it work for contested zones?
Gradient shading uses smooth color transitions to represent territorial uncertainty and administrative control levels. High-intensity colors indicate areas with strong governmental presence, while lower intensity shows limited control regions. This technique maintains visibility of underlying geographic details while effectively illustrating different levels of territorial influence.
How should different boundary lines be used in dispute mapping?
Use solid lines for official government claims and internationally recognized borders with thick, continuous lines in distinct colors. Implement dashed lines for historical boundaries to show past territorial divisions’ influence. Apply dotted lines for de facto control areas, representing actual territorial governance regardless of international recognition status.
What are interactive toggle layers and their benefits?
Interactive toggle layers transform static maps into dynamic tools allowing users to switch between different territorial claims using radio button controls. They include time-based layers with slider controls for historical context and selective visibility controls for managing complex disputes through intuitive hierarchical menus, enhancing user engagement and understanding.
Why is cartographic neutrality important when mapping disputes?
Cartographic neutrality ensures professional, objective presentation of territorial disputes without taking political sides. It maintains geographic accuracy while presenting contested boundaries informatively. This approach builds credibility, ensures broader audience acceptance, and allows viewers to form their own opinions based on clear, unbiased visual information.