5 Best Digital Map Projection Experiments
Why it matters: Projection parameters determine how 3D objects appear on 2D screens and understanding them transforms how you approach visual learning and spatial reasoning.
The big picture: These five hands-on experiments let you manipulate field of view, aspect ratios, and clipping planes to see firsthand how minor adjustments create dramatically different visual outcomes.
What’s next: You’ll discover why architects use orthographic projections while game developers prefer perspective projections — and gain practical skills that apply across multiple disciplines from computer graphics to engineering design.
Disclosure: As an Amazon Associate, this site earns from qualifying purchases. Thank you!
P.S. check out Udemy’s GIS, Mapping & Remote Sensing courses on sale here…
Understanding Basic Projection Parameters and Their Educational Value
Projection parameters serve as the foundation for transforming Earth’s curved surface onto flat maps, making them essential tools for geographic education.
Achieve a flawless, even complexion with e.l.f. Flawless Satin Foundation. This lightweight, vegan formula provides medium coverage and a semi-matte finish for all-day wear, while hydrating your skin with glycerin.

Defining Map Projections and Key Parameters
Map projections mathematically transform geographic coordinates from Earth’s spherical surface to flat representations. Key parameters include the central meridian (longitude of projection center), standard parallels (latitude lines with minimal distortion), and false easting/northing (coordinate system origins). You’ll encounter datum specifications like WGS84 and NAD83, which define Earth’s shape for calculations. Scale factors determine how distances compress or stretch across different map regions, while projection zones like UTM create localized coordinate systems for improved accuracy.
Why Projection Parameters Matter in Geographic Education
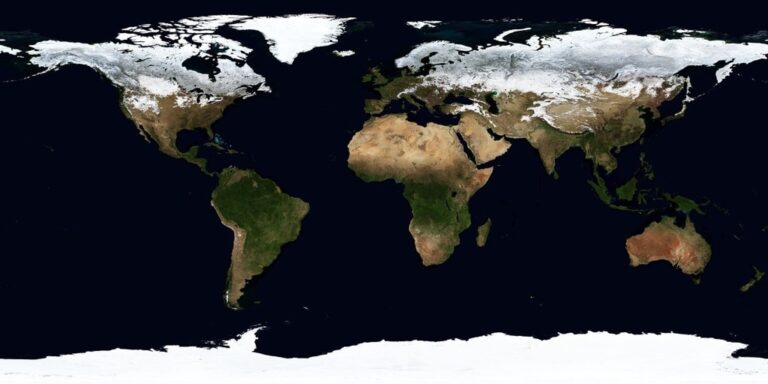
Projection parameters directly impact how students interpret spatial relationships and measure distances on maps. You’ll notice that Mercator projections exaggerate polar regions, making Greenland appear larger than Africa, while equal-area projections like Albers preserve size relationships for demographic analysis. Coordinate reference systems affect GPS accuracy and surveying measurements, with incorrect parameters causing positional errors exceeding 100 meters. Understanding these parameters helps students recognize map distortions and choose appropriate projections for specific geographic analyses, from urban planning to environmental monitoring.
Essential Tools and Software for Student Experiments
QGIS provides free access to projection transformation tools, allowing students to experiment with coordinate systems through its CRS selector. ArcGIS Online offers web-based projection comparisons without requiring software installation, while Proj4js enables interactive projection experiments in web browsers. Google Earth demonstrates projection effects by switching between different viewing modes, and Natural Earth provides ready-made projection examples for classroom demonstrations. Coordinate transformation calculators like NCAT help students understand parameter relationships, while open-source libraries like GDAL support advanced projection experiments for programming-oriented learners.
Experimenting With Mercator Projection Scale Distortion
Understanding Mercator projection’s scale distortion provides crucial insights into how cylindrical projections transform Earth’s surface. This hands-on experiment reveals the dramatic variations in area representation that occur at different latitudes.
Setting Up the Mercator Projection Parameter Test
Create a base map using QGIS or ArcGIS Pro with the World Mercator projection (EPSG:3395). Load a graticule layer showing 15-degree latitude and longitude intervals to visualize the grid system. Add identical circles at 0°, 30°, 60°, and 75° latitude using the buffer tool with a 1000-kilometer radius. Configure your map extent to display from 85°N to 85°S latitude for complete visualization.
Measuring Area Distortion at Different Latitudes
Calculate the actual area of each circle using the field calculator in your GIS software. Compare the visual appearance of circles on screen – you’ll notice dramatic size differences despite identical ground measurements. Record the scale factor at each latitude: equatorial circles appear normal, while circles at 60°N appear twice their actual size, and those at 75°N appear four times larger than reality.
Analyzing Distance and Shape Changes
Measure distances between meridians at different latitudes using your GIS measurement tool. Observe how meridian spacing remains constant on Mercator projections while actual ground distances decrease toward the poles. Examine how shapes remain conformal (angles preserved) but areas become increasingly distorted. Note that a 1000-kilometer circle near Greenland appears larger than entire countries near the equator.
Educational Applications and Real-World Examples
Demonstrate Mercator distortion using familiar examples like Greenland appearing larger than Africa when it’s actually 14 times smaller. Show students how GPS navigation systems account for these distortions through coordinate transformations. Explain why web mapping services like Google Maps use Web Mercator (EPSG:3857) despite its limitations. Connect these concepts to climate data visualization where polar regions appear disproportionately large in temperature anomaly maps.
Navigate confidently with the Garmin Drive™ 53 GPS. This navigator features a bright, high-resolution touchscreen and provides helpful driver alerts for school zones, speed changes, and more.

Exploring Coordinate System Transformations Through Parameter Modification
You’ll discover how systematic parameter adjustments reveal the mathematical relationships between different coordinate systems and their real-world applications.
Changing Datum Parameters for Hands-On Learning
Datum shifts demonstrate how reference surfaces affect coordinate accuracy across different regions. You can experiment with NAD27 versus NAD83 transformations using the same geographic location to observe coordinate differences of several meters. Load identical GPS points into both datum systems and measure the positional variations. These experiments highlight why datum selection matters for surveying accuracy, property boundaries, and emergency response systems where precise location data proves critical.
Shifting Prime Meridians and Central Meridians
Prime meridian adjustments reveal how longitude calculations change based on your reference starting point. You’ll observe dramatic coordinate value changes when switching from Greenwich (0°) to other historical prime meridians like Paris (2°20′14″E) or Ferro (17°40′W). Central meridian modifications in projected coordinate systems affect false easting values and zone boundaries. Practice with UTM zones by moving between adjacent zones and calculating the coordinate transformations for the same geographic feature.
Understanding False Easting and False Northing Values
False coordinates eliminate negative values by adding constant offsets to projected coordinate systems. You can demonstrate this concept by comparing State Plane Coordinate systems with and without false easting values applied. Most systems use 500,000 meters false easting to ensure all coordinates remain positive. Remove these values temporarily to see how coordinates would appear in their raw mathematical form, then restore them to understand why cartographers implement these practical adjustments.
Student Activities for Coordinate System Comprehension
Interactive exercises using multiple coordinate systems build spatial reasoning skills through direct manipulation. You’ll benefit from plotting the same landmark using Geographic (lat/lon), UTM, and State Plane coordinates to visualize how different systems represent identical locations. Create comparison tables showing coordinate values for major cities across various projections. Use online coordinate conversion tools to verify manual calculations and explore how coordinate precision affects mapping accuracy at different scales.
Investigating Equal-Area Projection Properties With Parameter Adjustments
Equal-area projections maintain accurate area relationships across mapped regions, making them essential for statistical analysis and thematic mapping. You’ll discover how parameter adjustments affect area preservation through systematic testing.
Configuring Albers Equal-Area Conic Parameters
Configure your Albers projection by setting two standard parallels that bracket your study area. Position the first parallel at one-sixth the total latitude range from the southern boundary, and place the second parallel at one-sixth from the northern boundary. Set your central meridian to the longitude center of your mapping region. Adjust the false easting to 500,000 meters and false northing to 0 meters for standard North American applications.
Testing Standard Parallel Modifications
Test different standard parallel configurations by creating multiple map versions with varying parallel positions. Move your standard parallels closer together to reduce distortion in smaller study areas, or spread them wider for continental mapping. Document scale factor changes at 5-degree intervals between parallels. Compare grid convergence angles across your test configurations to identify optimal parameter combinations for your specific mapping requirements.
Comparing Area Preservation Across Different Regions
Compare area measurements using identical geometric shapes placed at different latitudes across your equal-area projection. Create 100-square-kilometer reference circles and position them at 10-degree latitude intervals. Calculate area deviations from true values using your GIS measurement tools. Document how shapes maintain consistent areas while experiencing angular and linear distortions, particularly near projection boundaries where shape preservation decreases significantly.
Classroom Exercises for Equal-Area Understanding
Design hands-on exercises where students measure state or country areas using different projection parameters. Have students compare census data accuracy between equal-area and conformal projections for population density mapping. Create worksheets requiring standard parallel optimization for specific geographic regions. Assign projects where students justify projection parameter choices for thematic maps showing agricultural production, forest coverage, or electoral districts requiring accurate area representation.
Analyzing Azimuthal Projection Center Point Effects
Azimuthal projections offer unique insights into how map center points dramatically influence spatial relationships and measurement accuracy.
Setting Different Projection Center Coordinates
Azimuthal projection centers control the map’s tangent point and determine where distortion remains minimal. You’ll configure center coordinates by adjusting latitude and longitude values in your GIS software’s projection parameters dialog. Start with your study area’s geographic center, then experiment with locations at 30° intervals. QGIS users access these settings through Project Properties > CRS, while ArcGIS Pro users modify coordinates in the Map Properties panel.
Observing Distance and Direction Accuracy Changes
Distance measurements become increasingly inaccurate as you move away from the projection center point. You’ll notice that azimuthal equidistant projections maintain true distances only along great circle paths radiating from the center. Measure identical geographic features at varying distances from your center point using your GIS measurement tools. Record how 1000-kilometer distances appear longer or shorter depending on their angular position relative to the projection center.
Understanding Great Circle Paths and Navigation
Great circle navigation becomes visually intuitive when your projection center matches your departure point or area of interest. You’ll observe how flight paths and shipping routes appear as straight lines radiating from the center, while the same routes curve dramatically on other projection types. Use the azimuthal gnomonic projection to demonstrate this principle, plotting air routes between major cities and comparing the visual representation to Mercator projection equivalents.
Practical Applications for Geography Students
Geographic education benefits significantly from hands-on azimuthal projection experiments that demonstrate real-world navigation principles. You’ll help students understand polar research logistics by centering projections on Antarctic research stations, or military applications by focusing on strategic locations. Create comparative exercises where students measure distances from their school to world capitals using different center points, revealing how projection choice affects spatial perception and decision-making processes.
Demonstrating Universal Transverse Mercator (UTM) Zone Parameters
UTM projection parameters demonstrate how systematic zone divisions create globally consistent coordinate systems. Each 6-degree zone uses specific mathematical parameters that you can manipulate to understand projection behavior.
Exploring UTM Zone Boundaries and Overlaps
Zone boundaries occur every 6 degrees of longitude, creating 60 zones worldwide that you can examine in QGIS or ArcGIS Pro. Overlap areas extend 30 arcminutes beyond each zone boundary, allowing you to compare coordinate accuracy between adjacent zones. Load datasets spanning multiple UTM zones to observe how features appear differently when projected using Zone 10N versus Zone 11N parameters. Test coordinate precision by measuring the same landmark in overlapping zones and document the numerical differences.
Adjusting Central Meridian Parameters
Central meridian values define each UTM zone’s mathematical center, typically at -177°, -171°, -165° for zones 1, 2, 3 respectively. You can modify these parameters in projection definitions to observe how shifting the central meridian affects coordinate values and distortion patterns. Create custom UTM zones by adjusting the central meridian to -120° instead of -123° for Zone 10, then measure how this 3-degree shift impacts accuracy across your study area.
Understanding Zone-Specific Coordinate Systems
Zone-specific parameters include false easting (500,000 meters), false northing (0 for northern hemisphere), and scale factor (0.9996) that you can experiment with in GIS software. Each UTM zone maintains consistent parameters while adapting to different geographic regions through central meridian adjustments. Compare coordinate values between EPSG:32610 (UTM Zone 10N) and EPSG:32611 (UTM Zone 11N) using identical geographic points to understand how zone-specific transformations affect spatial calculations and measurement accuracy.
Field Work Applications and GPS Integration
GPS receivers automatically select appropriate UTM zones based on location, but you can manually configure specific zone parameters for surveying applications. Field data collection becomes more accurate when you understand how GPS coordinates relate to UTM zone boundaries and projection parameters. Practice converting between geographic coordinates and UTM using handheld GPS units, then verify results using coordinate transformation tools in QGIS to build confidence in field data accuracy and spatial reference system selection.
Get fast, accurate GPS positioning for your laptop, PC, car, or boat with this USB receiver. It features a high-performance chip for multi-GNSS support and a magnetic base for easy installation.

Conclusion
These five projection parameter experiments provide you with practical skills that extend far beyond the classroom. You’ll develop a deeper understanding of how mathematical concepts translate into real-world applications across cartography engineering and computer graphics.
By working hands-on with different projection systems you’re building spatial reasoning abilities that professionals use daily. Whether you’re planning to work in GIS surveying or game development these foundational skills will serve you well.
The beauty of projection parameters lies in their versatility. You can apply the same principles to visualize climate data design navigation systems or create accurate land surveys. Each experiment builds upon the previous one creating a comprehensive understanding of coordinate systems.
Your journey with projection parameters doesn’t end here. Continue experimenting with different software tools and real-world datasets to strengthen your skills and discover new applications in your field of interest.
Frequently Asked Questions
What are projection parameters and why are they important in visual learning?
Projection parameters control how 3D objects appear on 2D screens and how Earth’s curved surface is displayed on flat maps. They’re crucial for visual learning because small parameter changes can dramatically affect appearance, spatial relationships, and measurements. Understanding these parameters helps students develop spatial reasoning skills essential for computer graphics, engineering, geography, and GIS applications.
How do field of view and aspect ratios affect 3D object visualization?
Field of view determines how much of a scene is visible, with wider angles showing more content but potential distortion at edges. Aspect ratios control the width-to-height relationship of the display. These parameters significantly impact how objects appear proportionally and can make the same 3D model look completely different depending on the settings chosen.
What’s the difference between orthographic and perspective projections?
Orthographic projections maintain parallel lines and accurate measurements, making them preferred in architecture and technical drawings. Perspective projections simulate human vision with vanishing points and depth perception, making them ideal for game development and realistic visualizations. Each serves different purposes depending on whether accuracy or realism is prioritized.
How do map projection parameters affect geographic accuracy?
Map projection parameters like central meridian, standard parallels, and scale factors determine how Earth’s curved surface translates to flat maps. Different parameter settings affect distance measurements, area calculations, and shape representation. Understanding these parameters is essential for accurate GPS navigation, surveying, and geographic analysis in various fields.
What is scale distortion in the Mercator projection?
Scale distortion in Mercator projection occurs because areas appear increasingly larger at higher latitudes. While angles are preserved, a circle at 60°N appears much larger than an identical circle at the equator. This explains why Greenland appears similar in size to Africa on world maps, despite Africa being 14 times larger.
Get durable, tear-resistant posters made in the USA. Each 18" x 29" poster features high-quality 3 MIL lamination for lasting protection.

How do coordinate system transformations work through parameter modifications?
Coordinate system transformations involve changing mathematical relationships between different reference systems. Modifying parameters like datum (NAD27 to NAD83), prime meridians, or central meridians affects coordinate accuracy and positioning. These transformations are crucial for integrating data from different sources and ensuring precise location information in surveying and emergency response.
What are equal-area projections and when should they be used?
Equal-area projections preserve accurate area relationships, making them essential for statistical analysis and thematic mapping. Unlike conformal projections that preserve angles, equal-area projections ensure that relative sizes of geographic features remain true. They’re particularly important when comparing census data, population densities, or any analysis requiring accurate area measurements.
What is the Universal Transverse Mercator (UTM) system?
UTM is a global coordinate system that divides Earth into 60 zones, each 6 degrees wide. Each zone has specific parameters including central meridian, false easting, and scale factors. UTM provides consistent, high-accuracy positioning worldwide, making it essential for GPS integration, fieldwork, and data collection where precise coordinates are critical.
Which GIS software tools are best for learning projection parameters?
QGIS (free, open-source) and ArcGIS Pro/Online are the most recommended tools for hands-on projection parameter experiments. These platforms allow students to manipulate projections, measure distortions, transform coordinates, and visualize parameter effects in real-time. They provide essential practical experience for understanding theoretical concepts through interactive learning.
How can students practice with projection parameters effectively?
Students should engage in hands-on activities like plotting landmarks in different coordinate systems, measuring area distortions across various projections, and using online coordinate conversion tools. Comparing identical features across different projections, experimenting with parameter adjustments, and analyzing real-world examples help build practical spatial reasoning skills essential for professional applications.