8 Ways to Document Historical Land Use Changes Through Maps
You’re looking at old maps wrong. These historical documents aren’t just pretty wall decorations – they’re powerful tools that reveal how land transformed over decades and centuries. Maps tell the story of human progress through agricultural expansion urban development and environmental changes that shaped the world you live in today.
The challenge isn’t finding historical maps – it’s knowing how to read them properly. Most people miss critical details that document everything from forgotten settlements to vanished forests. Learning to decode these geographical time capsules gives you access to land use patterns that modern satellite imagery simply can’t capture.
Disclosure: As an Amazon Associate, this site earns from qualifying purchases. Thank you!
How to Document Historical Land Use Changes Through Maps: A Complete Guide
Start with map collection and chronological organization to establish your baseline documentation framework. You’ll need to gather historical maps from multiple time periods, typically spanning 50-100 years for comprehensive land use analysis. Focus on acquiring topographic surveys, cadastral maps, and aerial photographs from government archives, local historical societies, and digital repositories like the USGS Historical Topographic Map Collection.
P.S. check out Udemy’s GIS, Mapping & Remote Sensing courses on sale here…
Create a standardized coordinate system for all your historical materials using modern GIS software like ArcGIS Pro or QGIS. You’ll georeferenced each historical map to a common projection, typically State Plane or UTM coordinates, ensuring spatial accuracy within 5-10 meters. This process involves identifying control points such as road intersections, property corners, or natural features that remain consistent across time periods.
Develop a land use classification system that captures the specific changes you’re documenting. Standard categories include agricultural land, forest cover, urban development, wetlands, and industrial areas. You’ll assign consistent color codes and symbology to each category, making visual comparisons easier across different time periods. Document your classification criteria in a detailed legend that other researchers can replicate.
Digitize land use boundaries systematically using polygon features in your GIS software. You’ll trace each land use type as separate vector layers, maintaining consistent topology and avoiding gaps or overlaps between polygons. Create attribute tables that include area calculations, confidence levels, and source documentation for each digitized feature.
Perform change detection analysis by overlaying maps from different time periods and calculating area statistics for each land use category. You’ll generate transition matrices showing exactly how much land converted from one use to another, such as forest to agriculture or farmland to urban development. Export these findings as both tabular data and visual change maps that highlight transformation patterns.
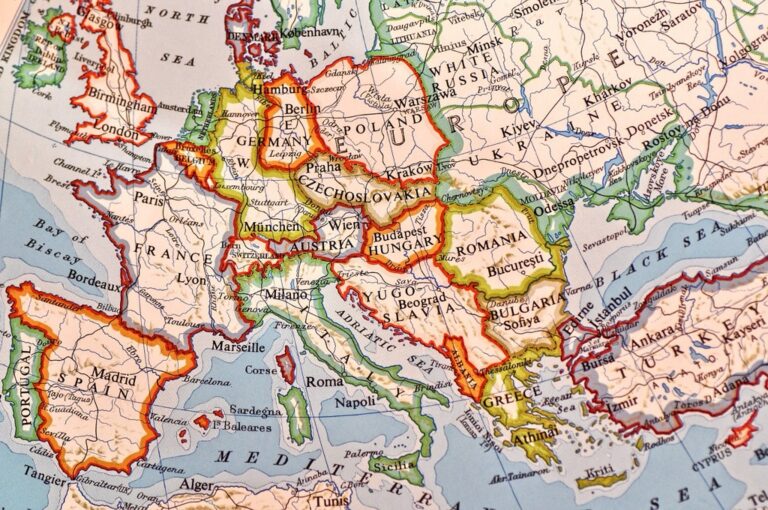
Gather Historical Maps and Aerial Photography From Multiple Time Periods
Explore history's most significant maps with *Great Maps*. This book delves into cartographic masterpieces and their historical context.

You’ll need maps spanning at least 50-100 years to capture meaningful land use transitions. Start collecting materials systematically to build a comprehensive temporal dataset.
Identify Primary Sources for Historical Maps
Government archives serve as your most reliable sources for historical mapping materials. The U.S. Geological Survey maintains extensive collections of topographic maps dating back to the 1880s through their Historical Topographic Map Collection. State geological surveys often house regional mapping projects that complement federal datasets. County recorder offices preserve cadastral maps showing property boundaries and early subdivision plats. Military mapping archives contain detailed reconnaissance maps created during wartime that document land use with exceptional precision for strategic purposes.
Learn essential map reading and navigation skills with this U.S. Army guide. Designed for practical use, it provides clear instructions for navigating any terrain.

Locate Aerial Photography Archives
USDA aerial photography provides the most comprehensive coverage for rural areas, with systematic flights beginning in the 1930s through the National Agriculture Imagery Program. The National Archives houses World War II-era aerial reconnaissance photos covering urban and strategic areas. State departments of transportation maintain aerial surveys conducted for highway planning projects. University libraries often digitize regional aerial photography collections, making them accessible through online portals. Commercial aerial survey companies sometimes donate historical flight records to local historical societies.
Collect Topographic Survey Maps
USGS quadrangle maps form the backbone of topographic documentation, with systematic 15-minute and 7.5-minute series covering the entire United States. Historical editions show landscape evolution through consistent symbology and elevation data. Coast and Geodetic Survey charts document coastal land use changes with precise shoreline mapping. Military topographic series like the Army Map Service products provide detailed terrain analysis for specific regions. Railroad survey maps capture 19th-century land use patterns along transportation corridors with exceptional detail about agricultural and industrial development.
Choose the Right Digital Mapping Software and Tools
Your digital mapping software selection determines how effectively you’ll analyze historical land use patterns and create accurate documentation.
Select Geographic Information System (GIS) Software
ESRI ArcGIS Pro offers the most robust georeferencing tools for historical maps with advanced spatial analysis capabilities. QGIS provides a cost-effective alternative with excellent historical map processing plugins including the Georeferencer GDAL tool. Both platforms support multiple coordinate systems essential for aligning maps from different time periods. You’ll need software that handles raster data efficiently since historical maps require extensive image processing and layer management for temporal analysis.
Evaluate Online Mapping Platforms
ArcGIS Online enables collaborative historical mapping projects with cloud-based storage for large historical datasets. Google Earth Engine provides powerful temporal analysis tools for comparing historical aerial imagery across decades. Story Maps platforms like Esri’s ArcGIS StoryMaps help present your land use change documentation in engaging visual narratives. These platforms offer seamless integration with mobile data collection and automated backup systems for protecting valuable historical research.
Understand the structure of a one-hour TV drama pilot. This book provides a guide to story mapping for television.

Consider Mobile Apps for Field Documentation
Survey123 streamlines field data collection with customizable forms for recording ground-truth observations during site visits. ArcGIS Field Maps allows real-time GPS tracking while comparing current conditions to historical map overlays. Collector for ArcGIS enables offline data collection in remote areas where historical land use verification requires fieldwork. Mobile apps prove essential for validating historical interpretations through contemporary site photography and precise location recording.
Track vehicles and assets with the LandAirSea 54 GPS Tracker. Get real-time location alerts and historical playback using the SilverCloud app, with a long-lasting battery and discreet magnetic mount.

Establish a Consistent Geographic Reference System
You’ll need a unified spatial framework to ensure accurate alignment across different historical periods and map sources.
Determine Appropriate Coordinate Systems
Choose UTM (Universal Transverse Mercator) for most regional historical land use studies since it provides consistent distance measurements across your study area. State Plane Coordinate Systems work well for localized projects within individual states, offering higher accuracy for smaller geographic extents. Web Mercator (EPSG:3857) suits online mapping platforms but introduces distortion at higher latitudes. Consider your study area’s geographic extent when selecting between these systems – UTM zones typically provide the best balance of accuracy and usability for historical mapping projects.
Align Historical Maps to Modern Projections
Georeference each historical map using at least 10-15 ground control points distributed evenly across the map extent. Use easily identifiable features like road intersections, building corners, and natural landmarks that appear in both historical and modern reference data. GDAL’s georeferencing tools and ArcGIS Pro’s georeferencing toolbar provide polynomial transformation methods for handling map distortion. Aim for root mean square error (RMSE) values below 5 meters for cadastral maps and 10-15 meters for older topographic sheets to maintain acceptable spatial accuracy standards.
Improve drone mapping accuracy with this 10-pack of numbered (0-9) 24"x24" GCP targets. Durable, waterproof Oxford cloth with high-contrast black and white design ensures clear visibility and reliable performance in various conditions.

Create Standardized Map Boundaries
Establish uniform study area boundaries using township sections, watersheds, or administrative boundaries that remain consistent across all time periods. Clip all georeferenced maps to identical extents using these standardized boundaries to eliminate edge effects during analysis. Create buffer zones of 500-1000 meters beyond your core study area to capture edge transitions and ensure complete coverage. Use vector polygon boundaries stored in your chosen coordinate system to maintain consistent spatial extents when digitizing land use features from different historical periods.
Develop a Land Use Classification System
You’ll need a standardized framework to categorize different land uses consistently across all your historical maps. This classification system becomes the foundation for accurate change detection analysis.
Achieve a flawless, even complexion with e.l.f. Flawless Satin Foundation. This lightweight, vegan formula provides medium coverage and a semi-matte finish for all-day wear, while hydrating your skin with glycerin.

Define Primary Land Use Categories
Establish broad categories that capture major landscape functions across your study period. Agriculture, urban development, forest cover, water bodies, and industrial areas form the core classification structure for most historical mapping projects.
Select 6-8 primary categories maximum to maintain analytical clarity. Transportation corridors, residential zones, commercial districts, recreational spaces, and undeveloped land provide comprehensive coverage while preventing classification overlap that complicates temporal analysis.
Create Subcategories for Detailed Analysis
Subdivide each primary category into specific land use types that reflect your study area’s characteristics. Agricultural land splits into cropland, pasture, orchards, and livestock facilities, while urban areas separate into high-density residential, commercial centers, and mixed-use developments.
Design subcategories based on your historical map resolution and available detail. Military installations, educational facilities, and cemetery grounds often appear as distinct features in older topographic surveys, warranting separate classification codes for comprehensive documentation.
Establish Consistent Coding Standards
Assign unique alphanumeric codes to each category and subcategory for database management. Use “AG01” for cropland, “UR02” for residential areas, and “FOR03” for deciduous forest to maintain systematic organization across multiple mapping periods.
Document your coding standards in a reference table with clear definitions and visual examples. Include minimum mapping unit sizes, boundary delineation rules, and mixed-use classification protocols to ensure consistent interpretation when multiple researchers analyze your historical datasets.
Digitize Historical Maps Into Geographic Layers
Converting historical maps into digital geographic layers transforms static documents into dynamic analytical tools. This process creates spatially accurate datasets that enable precise comparison and analysis across different time periods.
Scan and Georeference Historical Documents
Scan historical maps at 300-600 DPI resolution to capture fine details and text clarity. Use professional flatbed scanners for documents up to 11×17 inches or specialized large-format scanners for bigger maps. Import scanned images into GIS software like ArcGIS Pro or QGIS, then select ground control points on both the historical map and modern reference data. Choose at least 6-8 clearly identifiable landmarks such as road intersections, buildings, or geographic features that remain unchanged. Apply polynomial transformation to align the historical document with your established coordinate system, ensuring root mean square error stays below 5 meters for optimal accuracy.
Trace Land Use Boundaries Accurately
Create vector polygons by tracing land use boundaries directly over your georeferenced historical maps using digital editing tools. Start with the most prominent features like water bodies and urban areas, then work toward smaller agricultural parcels and forest boundaries. Use consistent digitizing scales between 1:2,000 and 1:5,000 to maintain precision while capturing necessary detail. Follow original map symbology and legend classifications, but adapt them to your standardized land use categories. Employ snapping tools to ensure polygon boundaries connect properly, eliminating gaps and overlaps that compromise spatial analysis accuracy.
Convert Paper Maps to Digital Formats
Transform paper maps into editable vector datasets through systematic digitization workflows. Begin by creating separate feature classes for each land use category in your geodatabase structure. Use heads-up digitizing techniques to trace boundaries while referencing both the historical map and contemporary aerial imagery for context. Apply attribute tables to store metadata including original map dates, sources, and confidence levels for each digitized feature. Export final vector layers as shapefiles or geodatabase feature classes, maintaining proper coordinate system information and symbology standards that facilitate integration with other temporal datasets in your historical analysis project.
Compare Maps Across Different Time Periods
Once you’ve digitized your historical maps into geographic layers, systematic comparison reveals the true scope of landscape transformation over time.
Overlay Historical and Current Maps
Overlay techniques allow you to visualize temporal changes by stacking georeferenced maps in your GIS software. You’ll create transparency effects using alpha blending in ArcGIS Pro or QGIS to show both historical boundaries and current features simultaneously. Set the historical layer to 50-70% opacity while keeping the base map fully visible. This reveals areas where land use boundaries have shifted, expanded, or disappeared entirely. Use swipe tools to create before-and-after comparisons that highlight dramatic transitions in urban growth or agricultural conversion.
Identify Areas of Significant Change
Change detection analysis pinpoints locations where land use transformations exceed your defined thresholds. You’ll run spatial analysis tools to calculate percentage changes within grid cells or polygon boundaries across your study period. Focus on areas showing greater than 25% land use conversion, as these represent significant landscape modifications. Create change magnitude maps using graduated symbols or color ramps to visualize transformation intensity. Document hotspots of urban sprawl, agricultural abandonment, or forest conversion that warrant detailed field verification and additional research.
Quantify Land Use Transitions
Transition matrices provide precise measurements of how specific land uses have changed between time periods. You’ll calculate the area converted from each historical category to current classifications using tabulate area tools in your GIS software. Generate cross-tabulation tables showing hectares or acres transferred between categories like agriculture-to-urban or forest-to-development. Calculate annual conversion rates by dividing total change by the number of years in your study period. Create summary statistics showing net gains, losses, and exchange patterns for each land use category across your entire study area.
Document Changes With Detailed Annotations
Comprehensive documentation transforms your land use analysis from simple observation into authoritative research. Creating systematic annotations ensures your findings remain valuable for future researchers and regulatory applications.
Record Dates and Sources of Changes
Document precise dates when land use transitions occurred by cross-referencing multiple historical sources. Create annotation fields that capture the original map publication date, survey completion date, and any known revision dates. Include source information such as surveying agency, map series number, and scale to establish data credibility and traceability for your analysis.
Add Descriptive Notes for Each Transition
Write detailed transition descriptions that explain the nature and extent of each land use change you’ve identified. Document specific changes like “agricultural fields converted to residential subdivision” rather than generic terms like “development.” Include measurements of affected acreage, transition timing, and any apparent catalysts such as infrastructure projects or policy changes that influenced the transformation.
Include Photographic Evidence When Available
Incorporate historical photographs to provide visual context for your documented land use transitions. Aerial photographs, ground-level images, and satellite imagery serve as powerful validation tools for your map-based analysis. Georeference photographs when possible and create photo annotation layers that link directly to corresponding map changes, ensuring comprehensive documentation of landscape evolution.
Create Visual Representations of Land Use Evolution
Transform your analyzed data into compelling visual narratives that clearly communicate historical land use patterns and changes over time.
Design Before-and-After Map Comparisons
Create side-by-side map layouts using identical scales and color schemes to highlight dramatic land use transformations. Position your historical baseline map alongside current conditions, ensuring both maps share the same geographic extent and projection. Add clear legends, north arrows, and scale bars to each map panel. Include inset maps showing broader regional context when documenting localized changes like urban expansion or agricultural conversion.
Develop Time-Series Map Animations
Build dynamic animations using GIS software’s temporal visualization tools to show gradual land use evolution across decades. Export your georeferenced historical maps as sequential frames, maintaining consistent symbology and map extent throughout the animation. Set appropriate time intervals between frames—typically 5-10 year increments work best for urban development patterns. Add timestamp labels and transition effects to help viewers follow the chronological progression of landscape changes.
Generate Statistical Charts and Graphs
Convert your transition matrices into bar charts, pie charts, and line graphs that quantify land use changes over time. Create area charts showing the proportion of different land uses across each time period in your study. Develop trend lines illustrating rates of change for specific land use categories like forest loss or urban growth. Include confidence intervals and data source annotations to maintain scientific credibility in your statistical visualizations.
Verify Findings Through Field Research and Additional Sources
Your map-based analysis requires validation through field verification and additional source documentation. Ground-truthing ensures your historical land use interpretations accurately reflect past landscape conditions.
Conduct On-Site Investigations
Visit documented change locations to verify your map findings through physical evidence. Look for remnant foundations, old fence lines, soil composition changes, and vegetation patterns that confirm historical land uses. Document GPS coordinates of significant features and photograph evidence that supports your map analysis. Compare current topography with historical contour lines to identify grading, filling, or excavation activities that altered the original landscape.
Interview Long-Time Residents
Contact elderly community members who’ve witnessed land use transitions firsthand. Ask specific questions about farming practices, industrial operations, and development patterns they remember from decades past. Record interviews and request permission to cite their accounts in your documentation. Local historical societies often maintain contact lists of knowledgeable residents willing to share their memories about landscape changes.
Cross-Reference With Historical Records
Research municipal planning documents, property deeds, and newspaper archives to corroborate your map-based findings. County assessor records provide detailed property use classifications and ownership changes over time. Agricultural extension reports document farming practices and crop rotations that may not appear clearly on maps. Industrial permits and environmental impact studies reveal land use activities that occurred between mapping periods.
Organize and Archive Your Documentation
Effective organization transforms your historical land use analysis from scattered findings into a professional research archive. Systematic documentation practices ensure your work remains accessible and valuable for future projects.
Create Comprehensive Metadata Records
Document each map source with essential metadata including acquisition date, original scale, scanning resolution, and georeferencing accuracy. Record the projection system, coordinate precision, and any transformations applied during digitization. Include source reliability ratings and processing notes that describe interpretation challenges you encountered. Add keywords for land use categories, geographic features, and time periods to enable efficient searches. Store metadata in standardized XML or CSV formats that remain readable across different software platforms.
Establish File Naming Conventions
Develop consistent naming patterns that include location, date, map type, and processing stage in each filename. Use formats like “CountyName_YYYY_TopoMap_Georeferenced.tif” to maintain chronological sorting and quick identification. Avoid spaces and special characters that cause compatibility issues across operating systems. Create abbreviated codes for common map types such as “TOPO” for topographic maps and “AERIAL” for aerial photography. Maintain a reference document explaining all naming conventions and codes used throughout your project.
Develop Backup and Storage Systems
Implement a 3-2-1 backup strategy with three copies of critical files stored on two different media types and one offsite location. Use cloud storage services like Google Drive or Dropbox for automatic synchronization and version control. Organize folders by geographic region and time period to match your analysis workflow. Schedule regular backup verification to ensure file integrity and test restoration procedures annually. Consider long-term format migration plans since proprietary GIS formats may become obsolete over decades.
Conclusion
Documenting historical land use changes through maps transforms static historical documents into powerful analytical tools that reveal decades of landscape evolution. You’ve learned to combine traditional cartographic resources with modern GIS technology to create comprehensive visual narratives of land transformation.
The systematic approach outlined—from collecting historical maps through field verification—ensures your research meets scientific standards while remaining accessible to diverse audiences. Your documented findings become valuable resources for urban planners environmental researchers and policy makers.
By mastering these techniques you’ll contribute to preserving critical historical knowledge while supporting evidence-based decision making for future land use planning. The stories hidden within historical maps are waiting for you to discover and share them with the world.
Frequently Asked Questions
What are historical maps and why are they important for land use analysis?
Historical maps are valuable resources that document the evolution of land over time, revealing stories of human progress including agricultural growth, urban development, and environmental changes. They provide insights into past land use patterns that modern satellite imagery cannot convey, making them essential tools for understanding landscape transformation and documenting how areas have changed over decades or centuries.
What types of historical maps should I collect for land use analysis?
Focus on collecting topographic surveys, cadastral maps, and aerial photographs spanning 50-100 years. Government archives like the U.S. Geological Survey’s Historical Topographic Map Collection, state geological surveys, USDA aerial photography, and World War II-era reconnaissance photos are excellent sources. Organize these maps chronologically to track changes effectively over time.
What software is recommended for analyzing historical land use patterns?
GIS software like ESRI ArcGIS Pro and QGIS are highly recommended for professional analysis. These tools allow you to georeference historical maps, create standardized coordinate systems, digitize land use boundaries, and perform change detection analysis. Online mapping platforms can also be useful for collaborative projects, while mobile apps help with field documentation.
How do I create a land use classification system for historical maps?
Develop a consistent classification system with standardized color codes for different land uses such as agricultural, residential, commercial, industrial, and natural areas. Use the same categories across all time periods to enable accurate comparisons. This systematic approach ensures consistency when digitizing boundaries and analyzing transitions between different land use types over time.
What is change detection analysis and how does it work?
Change detection analysis involves overlaying historical and current maps in GIS software to identify areas of significant transformation. Use transparency effects to visualize changes, then create transition matrices to quantify how specific land uses have changed over time. This process provides precise measurements of landscape transformation and reveals patterns of development or land use conversion.
How can I verify the accuracy of my historical map findings?
Conduct field research to confirm map findings with physical evidence like remnant foundations and vegetation patterns. Interview long-time residents for firsthand accounts of land use transitions. Cross-reference your findings with historical records including municipal planning documents, agricultural reports, and other archival sources to ensure your interpretations accurately reflect past conditions.
What’s the best way to document and organize historical land use research?
Create comprehensive metadata records for each map source, including acquisition details and reliability ratings. Establish consistent file naming conventions for efficient searches. Record precise dates and sources of land use transitions, add descriptive notes for each change, and incorporate georeferenced photographs as visual evidence. Implement a robust backup system to protect your research data.
How can I create effective visual representations of land use changes?
Generate before-and-after map comparisons to highlight dramatic transformations, and create time-series animations to show gradual changes over decades. Develop statistical charts and graphs from transition matrices to quantify changes. Use transparency overlays in GIS software and maintain scientific credibility while creating compelling visual narratives that effectively communicate complex historical patterns.