7 Best Interactive Map UX Strategies
Why it matters: Interactive maps have become essential tools for businesses and organizations looking to engage users and deliver location-based information effectively. Poor map design can frustrate users and drive them away from your platform.
The big picture: Modern users expect seamless navigation intuitive controls and fast-loading interactive experiences when they interact with digital maps. Getting your map’s user experience right can significantly boost engagement conversions and user satisfaction.
What’s next: We’ll explore seven proven strategies that transform basic interactive maps into powerful user engagement tools that keep visitors coming back.
Disclosure: As an Amazon Associate, this site earns from qualifying purchases. Thank you!
P.S. check out Udemy’s GIS, Mapping & Remote Sensing courses on sale here…
Prioritize Intuitive Navigation Controls
You’ll create a seamless user experience when your interactive map features navigation controls that feel natural and respond predictably to user interactions.
Implement Clear Zoom and Pan Functions
Establish smooth zoom functionality that responds consistently across different devices and input methods. Your zoom controls should support mouse wheel scrolling, pinch gestures on touch devices, and traditional plus/minus buttons with clearly defined zoom levels. Configure pan operations to activate with simple click-and-drag motions, ensuring the map moves fluidly without lag or stuttering. Set appropriate zoom boundaries to prevent users from zooming too far out or into pixelated territory that compromises data readability.
Design Recognizable Map Control Icons
Select universally understood symbols like magnifying glasses for zoom functions, compass roses for orientation, and home icons for resetting to default views. Your control icons should follow established web mapping conventions from platforms like Google Maps and OpenStreetMap to leverage users’ existing mental models. Maintain consistent icon sizing between 24-32 pixels for optimal visibility across devices, and use high-contrast colors that remain visible against varying map backgrounds. Test icon recognition with users unfamiliar with your specific mapping application.
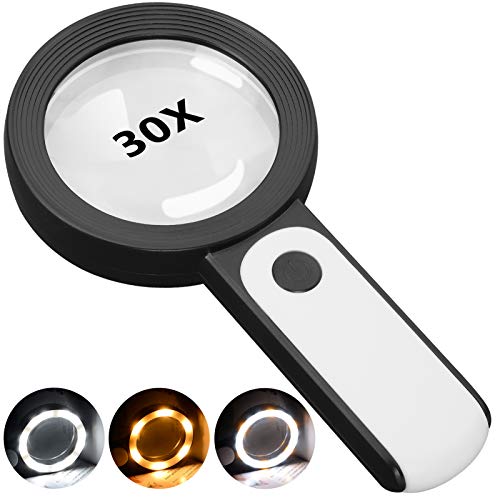
This 30X magnifying glass helps users with low vision easily read small text. Featuring a large 3.15" lens and 18 LEDs with adjustable cool, warm, and mixed light modes, it reduces eye strain and improves reading in any lighting.
Position Controls for Easy Accessibility
Place primary navigation controls in the top-right or bottom-right corners where users naturally expect them, following established mapping interface patterns. Your control placement should avoid overlapping critical map data while remaining easily accessible with both mouse and touch interactions. Ensure adequate spacing of at least 8-10 pixels between individual controls to prevent accidental activation, and maintain consistent positioning across different screen sizes through responsive design principles.
Optimize Loading Speed and Performance
Fast-loading interactive maps keep users engaged and prevent abandonment during data retrieval. Performance optimization becomes critical when dealing with large geographic datasets and complex visualizations.
Minimize Map Tile Load Times
Compress map tiles using WebP or optimized PNG formats to reduce file sizes by 30-40% without sacrificing visual quality. Choose tile servers with global content delivery networks (CDNs) like Mapbox or Google Maps Platform that cache tiles closer to your users’ geographic locations. Implement tile size optimization by using 256×256 pixel tiles instead of larger formats, which load faster on mobile connections and reduce bandwidth consumption.
Implement Progressive Loading Techniques
Load base map layers first before adding data overlays to give users immediate visual feedback while complex features render in the background. Use skeleton screens or placeholder graphics during initial load phases to maintain user engagement. Implement lazy loading for off-screen map elements, only rendering markers and polygons when they enter the viewport. This technique reduces initial memory usage and improves perceived performance significantly.
Cache Frequently Accessed Map Data
Store commonly requested map tiles in browser cache with appropriate expiration headers to eliminate redundant server requests during user sessions. Implement service worker caching for offline functionality, allowing users to access previously viewed map areas without internet connectivity. Use localStorage for frequently accessed geographic boundaries, point data, and user preferences. Set cache duration based on data volatility—static boundaries can cache for weeks while real-time data requires shorter intervals.
Enhance Visual Hierarchy and Information Display
Your map’s visual design determines how quickly users can locate relevant information and make informed decisions.
Use Strategic Color Coding Systems
Color coding creates instant visual associations that help users categorize and prioritize map elements. You’ll want to establish consistent color schemes where red indicates high priority or danger zones, green represents safe or positive areas, and blue marks informational features. Use distinct color palettes for different data layers to prevent visual confusion. Consider colorblind accessibility by incorporating patterns or symbols alongside color differences, ensuring your maps remain functional for all users.
Implement Effective Layering Techniques
Layering techniques organize complex information into digestible visual hierarchies that prevent cognitive overload. You should stack base map elements at the bottom, followed by contextual data layers, and place interactive elements on top for easy access. Use opacity levels to show overlapping data without hiding important details underneath. Group related information into toggleable layers that users can control, allowing them to customize their viewing experience based on specific needs or tasks.
Balance Information Density and Clarity
Information density requires careful calibration to maintain usability while providing comprehensive data coverage. You’ll need to implement dynamic label sizing that adjusts based on zoom levels, showing general categories at wide views and specific details when zoomed in. Use clustering techniques to group nearby markers at lower zoom levels, then expand to individual points as users focus on specific areas. Establish minimum spacing requirements between interactive elements to prevent accidental selections and ensure touch-friendly experiences across all devices.
Integrate Responsive Design for Multi-Device Compatibility
Your interactive map’s success depends on delivering consistent functionality across smartphones, tablets, and desktop computers. Modern users expect seamless transitions between devices without losing map state or encountering interface barriers.
Experience vivid content on the Galaxy A16 5G's 6.7" display and capture stunning photos with its triple-lens camera. Enjoy peace of mind with a durable design, six years of updates, and Super Fast Charging.

Adapt Touch Gestures for Mobile Interfaces
Touch-based interactions require larger target areas and gesture-specific controls for optimal mobile map performance. You’ll need to implement pinch-to-zoom functionality with smooth scaling transitions while maintaining map center positioning. Design tap targets at minimum 44×44 pixels to accommodate finger navigation and prevent accidental activations. Configure two-finger pan gestures for map movement while reserving single-finger taps for feature selection and information display.
Optimize Map Size for Different Screen Resolutions
Map container dimensions must dynamically adjust to viewport constraints while preserving essential geographic context. You should implement flexible grid systems that scale map height based on screen aspect ratios, typically maintaining 60-70% viewport coverage on mobile devices. Configure breakpoint-specific tile resolutions to balance visual quality with loading performance across device capabilities. Set minimum map dimensions of 320×240 pixels to ensure usability on compact screens while maximizing available space.
Ensure Cross-Platform Functionality
Browser compatibility testing across iOS Safari, Android Chrome, and desktop environments prevents functionality gaps that frustrate users. You’ll need to implement WebGL fallbacks for older browsers while maintaining consistent map rendering quality and performance standards. Test touch event handling across different operating systems to ensure gesture recognition works reliably. Configure feature detection scripts that adapt map controls based on device capabilities, providing alternative interaction methods when advanced features aren’t supported.
Implement Smart Search and Filter Capabilities
Smart search functionality transforms user interaction with complex geographic data. You’ll need to balance comprehensive search options with intuitive interface design.
Design Autocomplete Location Search Features
Autocomplete search reduces user effort and eliminates geographic spelling errors. You should integrate APIs like Google Places or Mapbox Geocoding to provide real-time suggestions as users type location queries. Configure search parameters to prioritize results within your map’s geographic bounds, ensuring relevant suggestions appear first. Design dropdown menus with clear location hierarchies showing city, state, and country information. Include search result previews that display coordinate accuracy and data source confidence levels to help users select appropriate locations.
Create Category-Based Filtering Options
Category filters help users narrow complex datasets to relevant information quickly. You’ll want to organize map elements into logical groupings like amenities, transportation, or business types using standardized classification systems. Design toggle switches or checkbox interfaces that allow multiple simultaneous filter selections while maintaining clear visual feedback. Implement filter combinations that work intuitively together, avoiding conflicting parameter sets that return empty results. Consider adding filter presets for common user scenarios like “restaurants near transit” or “outdoor recreation areas.”
Enable Advanced Search Parameters
Advanced parameters give power users precise control over geographic queries. You should provide distance radius controls, date range selectors, and attribute-based filtering options through expandable interface panels. Include numeric range sliders for continuous data like elevation, population, or ratings alongside dropdown menus for categorical attributes. Design parameter combinations that update results dynamically, showing result counts before users execute searches. Add saved search functionality that stores complex parameter combinations for repeated use across user sessions.
Provide Clear Visual Feedback and User Guidance
You’ll keep users engaged by implementing visual feedback systems that communicate map state changes and guide user interactions effectively.
Display Loading States and Progress Indicators
Loading states prevent user confusion during data retrieval processes. You should implement animated spinners or skeleton screens while map tiles and overlays render. Progress bars work effectively for large dataset imports or complex spatial analyses. Consider displaying percentage completion for tile loading sequences and include estimated time remaining for operations exceeding three seconds. Loading indicators maintain user confidence and reduce abandonment rates during processing delays.
Implement Hover and Click State Animations
Interactive state animations provide immediate feedback for user actions. You’ll enhance usability by adding subtle hover effects to clickable map elements like markers and polygons. Implement smooth color transitions or scale animations lasting 200-300 milliseconds for optimal responsiveness. Click states should include brief visual confirmations such as ripple effects or temporary highlighting. Consistent animation timing across all interactive elements creates a cohesive user experience and reinforces clickable areas.
Offer Contextual Help and Tooltips
Contextual guidance reduces learning curves for complex mapping interfaces. You should position informative tooltips near interactive elements that explain functionality without cluttering the interface. Implement progressive disclosure techniques that reveal advanced features gradually. Include keyboard shortcut hints and gesture instructions for mobile users. Smart help systems that adapt to user behavior patterns provide personalized guidance while maintaining clean visual design principles.
Incorporate Accessibility Features for Inclusive Design
You’ll maximize your interactive map’s reach by building accessibility into every design decision. This approach ensures users with disabilities can navigate and interact with your mapping interface effectively.
Support Keyboard Navigation Options
Enable full keyboard navigation to accommodate users who can’t use pointing devices. Implement tab order that follows logical map element progression, allowing users to cycle through zoom controls, layer toggles, and interactive features using standard keyboard shortcuts.
Configure arrow keys for map panning and plus/minus keys for zoom functionality. Include visible focus indicators that highlight currently selected elements, and provide keyboard shortcuts for frequently used actions like search activation or layer switching.
Implement Screen Reader Compatibility
Read comfortably with this lightweight, full-page 5X magnifying glass. Its large viewing area and ergonomic handle make it ideal for seniors and those with low vision to easily read small print.

Structure your map markup with proper ARIA labels and semantic HTML elements that screen readers can interpret. Use role attributes like “application” for interactive map containers and “button” for control elements to communicate functionality clearly.
Provide audio descriptions for visual map changes through live regions that announce zoom level changes, location updates, and filter applications. Implement skip links that allow screen reader users to bypass complex map interfaces and access essential information directly.
Provide Alternative Text for Map Elements
Write descriptive alt text for map markers, icons, and visual elements that conveys both content and context. Include location information, category details, and any status indicators that visual users would immediately recognize from color or shape cues.
Create text alternatives for complex geographic visualizations like heat maps or choropleth displays. Provide data tables or structured lists that present the same information in accessible formats, ensuring users can understand spatial relationships through alternative presentation methods.
Conclusion
Implementing these seven interactive map strategies will transform your basic mapping tool into a powerful user engagement platform. When you prioritize intuitive navigation optimize performance and design with accessibility in mind you’ll create experiences that keep users coming back.
Remember that successful interactive maps aren’t just about displaying data—they’re about making that data meaningful and accessible to every user. Your investment in responsive design smart search capabilities and clear visual feedback will pay dividends in user satisfaction and engagement metrics.
The key lies in continuous testing and refinement. Monitor how users interact with your maps gather feedback and iterate on your design decisions. With these strategies as your foundation you’re well-equipped to create interactive mapping experiences that truly serve your audience’s needs.
Achieve a flawless, even complexion with e.l.f. Flawless Satin Foundation. This lightweight, vegan formula provides medium coverage and a semi-matte finish for all-day wear, while hydrating your skin with glycerin.

Frequently Asked Questions
What makes an interactive map user-friendly?
User-friendly interactive maps feature intuitive navigation controls, fast loading speeds, clear visual hierarchy, and responsive design. Key elements include recognizable zoom/pan controls positioned in expected locations, compressed map tiles with CDN delivery, strategic color coding for visual associations, and mobile-optimized touch gestures. These features work together to create seamless navigation experiences across all devices.
How can I improve my interactive map’s loading speed?
Improve loading speed by compressing map tiles, using global CDNs for faster delivery, implementing progressive loading techniques, and caching frequently accessed data. Display skeleton screens during loading to maintain user engagement, and consider offline functionality for critical areas. These optimization strategies significantly reduce server requests and enhance overall performance.
What are the best practices for map visual design?
Effective map visual design uses strategic color coding systems with consistent schemes, implements proper layering techniques to organize complex information, and balances information density with clarity. Use dynamic label sizing, clustering techniques for dense data, and ensure colorblind accessibility. Allow users to control toggleable layers to prevent cognitive overload.
How do I make my interactive map mobile-friendly?
Create mobile-friendly maps by implementing responsive design that adapts to different screen sizes, optimizing touch gestures with larger target areas, and using flexible grid systems. Ensure cross-platform compatibility through thorough browser testing, implement fallback solutions, and adjust tile resolutions based on screen breakpoints for optimal mobile performance.
What search and filter features should I include?
Include autocomplete location search using APIs like Google Places or Mapbox Geocoding, category-based filtering with logical groupings and intuitive toggles, and advanced search parameters. Provide distance radius controls, date range selectors, and attribute-based filtering options that update results dynamically to help users navigate complex geographic datasets efficiently.
How can I provide better user feedback on my map?
Implement visual feedback systems with loading states, progress indicators, and animated spinners during data retrieval. Use hover and click state animations for immediate user action feedback, and include contextual help through informative tooltips. Smart help systems that adapt to user behavior while maintaining clean interfaces significantly improve user experience.
What accessibility features should my interactive map include?
Essential accessibility features include full keyboard navigation support with visible focus indicators, screen reader compatibility through proper ARIA labels and semantic HTML, and audio descriptions for visual changes. Provide alternative text for all map elements, ensure descriptive content context, and offer accessible formats to make your map inclusive for users with disabilities.