6 Key Cartographic Ethics in Data Representation That Build Trust
Why it matters: Maps shape how you see the world but they’re never neutral — every cartographic choice carries ethical weight that can influence public opinion policy decisions and social justice outcomes.
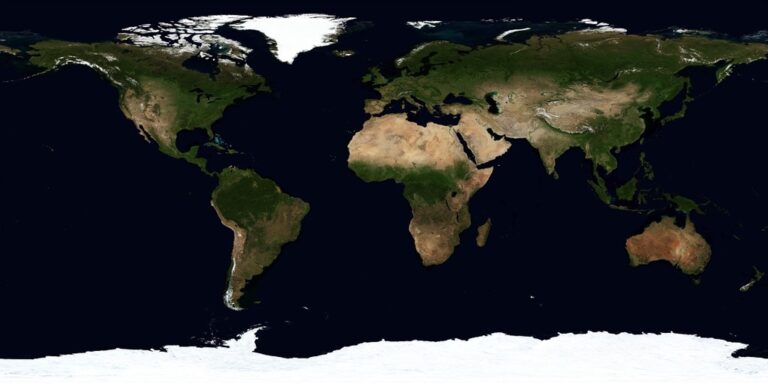
The big picture: From population density visualizations to climate change projections cartographers wield immense power in determining which stories get told and which communities get represented or overlooked entirely.
What’s next: Understanding these six core ethical principles will help you critically evaluate the maps you encounter daily and recognize how data representation choices can either promote equity or perpetuate harmful biases.
Disclosure: As an Amazon Associate, this site earns from qualifying purchases. Thank you!
P.S. check out Udemy’s GIS, Mapping & Remote Sensing courses on sale here…
Understanding the Foundation of Cartographic Ethics in Data Representation
Achieve a flawless, even complexion with e.l.f. Flawless Satin Foundation. This lightweight, vegan formula provides medium coverage and a semi-matte finish for all-day wear, while hydrating your skin with glycerin.

Every ethical mapping decision you make stems from recognizing that maps aren’t objective representations—they’re interpretative tools that carry profound social responsibility. Your understanding of these foundational principles determines whether your cartographic work promotes equity or perpetuates harmful biases.
Defining Ethical Mapping Principles
Ethical mapping principles center on truthfulness, inclusivity, and accountability in your data representation choices. You must prioritize accuracy while acknowledging the limitations and potential biases in your source datasets. Your responsibility extends beyond technical precision to include cultural sensitivity, ensuring marginalized communities aren’t misrepresented or excluded from your visualizations. These principles require you to consider the broader social impact of your cartographic decisions rather than focusing solely on aesthetic or technical excellence.
The Impact of Biased Cartographic Choices
Biased cartographic choices you make can perpetuate stereotypes, reinforce inequality, and influence policy decisions that affect real communities. Your color selections, classification methods, and scale choices directly impact how audiences interpret spatial data and form opinions about different populations or regions. When you use inappropriate symbology or outdated demographic categories, you risk marginalizing vulnerable groups and distorting public understanding of complex social issues. These seemingly technical decisions carry significant ethical weight that extends far beyond your immediate mapping project.
Ensuring Accuracy and Truthfulness in Geographic Data
Your geographic data accuracy directly impacts your map’s credibility and ethical standing. You’ll need systematic verification processes to maintain truthful representations.
Verifying Source Data Quality
You must evaluate your data sources against established quality metrics before incorporating them into cartographic products. Check for completeness by examining coverage gaps and temporal consistency across your datasets. Validate coordinates using multiple reference systems to identify positional errors that could mislead users. Cross-reference your primary sources with authoritative datasets from government agencies or reputable organizations. Document your data lineage to track accuracy degradation through processing workflows. Test random sample points against ground truth measurements when possible to quantify uncertainty levels.
Avoiding Misleading Visual Representations
You can prevent misinterpretation by selecting appropriate classification methods that reflect your data’s actual distribution patterns. Avoid using color schemes that create false emphasis or cultural bias in your visualizations. Choose class breaks that represent natural data groupings rather than arbitrary divisions that exaggerate differences. Scale your symbols proportionally to actual values to maintain visual honesty. Test your map with diverse audiences to identify potential misreadings before publication. Document your visualization choices to provide transparency about how you’ve interpreted the underlying data.
Maintaining Scale and Proportion Integrity
You need to preserve accurate spatial relationships throughout your mapping process to uphold cartographic truthfulness. Maintain consistent projection parameters across related map series to prevent distortion confusion. Apply appropriate generalization techniques that simplify features without losing essential geometric properties. Verify that your scale bar matches actual measured distances on your final output format. Use standardized symbols and sizing conventions that accurately represent real-world proportions. Calculate and display uncertainty margins when your data quality varies across different geographic regions.
Respecting Cultural Sensitivity and Indigenous Rights
Cultural sensitivity forms the foundation of ethical cartography when working with traditional territories and indigenous communities. You must recognize that maps aren’t just technical tools—they’re cultural documents that can either honor or erase indigenous heritage.
Acknowledging Traditional Place Names
Include indigenous place names alongside colonial designations to honor cultural heritage and provide historical context. Research traditional toponymy through tribal councils, cultural centers, and academic institutions specializing in indigenous studies. Verify spelling and pronunciation with community elders or cultural liaisons before publication. Cross-reference multiple sources to ensure accuracy, as oral traditions may have regional variations. Display traditional names prominently using consistent formatting that doesn’t subordinate them to colonial names.
Protecting Sacred and Sensitive Locations
Avoid mapping sacred sites, burial grounds, and ceremonially significant areas without explicit community permission and cultural protocols. Consult tribal historic preservation offices and cultural resource departments to identify sensitive locations that require protection from public disclosure. Implement data access restrictions using GIS security protocols that limit viewing permissions to authorized personnel only. Consider using generalized location data or buffer zones around sensitive areas to prevent precise identification while maintaining research value.
Consulting Local Communities Before Publication
Engage indigenous communities early in your mapping process through formal consultation protocols and community meetings. Schedule discussions with tribal councils, cultural committees, and community leaders before beginning data collection or analysis. Present preliminary maps for community review and incorporate feedback regarding cultural accuracy, appropriate representation, and potential concerns. Document consultation processes and obtain written permission for publication, ensuring communities retain control over how their territories and cultural sites are represented.
Promoting Accessibility and Inclusive Design
Ethical cartography requires creating maps that serve users with diverse needs and abilities. You must design geographic visualizations that remove barriers rather than create them.
Creating Maps for Diverse Abilities
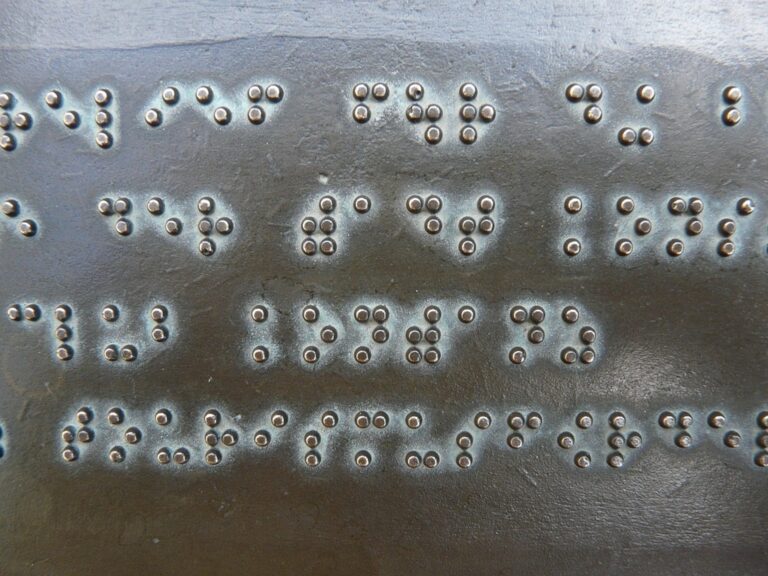
Visual impairments require specific design considerations in your mapping approach. You’ll need to provide alternative text descriptions for all map elements and ensure sufficient contrast ratios meet WCAG 2.1 AA standards. Screen reader compatibility becomes essential when you export maps to digital formats. Consider tactile mapping options for printed materials by incorporating raised textures and Braille labels where appropriate. Motor disabilities benefit from larger clickable areas and simplified navigation controls in interactive maps.
Read comfortably with this lightweight, full-page 5X magnifying glass. Its large viewing area and ergonomic handle make it ideal for seniors and those with low vision to easily read small print.

Using Universal Design Principles
Universal design creates maps that work for the widest possible range of users without requiring specialized adaptations. You should implement flexible presentation formats that allow users to adjust text size and contrast levels. Design clear visual hierarchies using consistent symbols and intuitive legend placement. Provide multiple ways to access the same information through both visual and textual elements. Your map layouts should accommodate different screen sizes and orientation preferences while maintaining spatial accuracy.
Ensuring Color-Blind Friendly Visualizations
Color accessibility affects approximately 8% of men and 0.5% of women worldwide who experience color vision deficiencies. You must test your color schemes using simulators like Coblis or Color Oracle before finalizing designs. Avoid red-green combinations and rely on patterns, textures, or shapes alongside color coding. Use ColorBrewer 2.0 to select scientifically-tested color palettes that remain distinguishable across different types of color blindness. Your legends should include both color and pattern keys to ensure comprehensive data interpretation.
Maintaining Transparency in Data Sources and Methodology
Transparency builds trust between cartographers and map users. Your documentation practices determine whether audiences can evaluate the reliability and limitations of your geographic representations.
Documenting Data Collection Methods
Document your field collection protocols to establish credibility in your mapping work. Record GPS accuracy specifications, survey dates, and sampling methodologies you used during data gathering. Include weather conditions and equipment calibration details that might affect measurement precision. Note any field constraints like access limitations or safety restrictions that influenced your collection approach. This documentation allows others to replicate your methods and understand potential data variations in your final maps.
Citing Original Data Sources
Reference primary data providers using complete attribution standards to maintain professional integrity. Include dataset names, publication dates, and version numbers for all government databases like Census Bureau or USGS sources. Provide DOI links or persistent URLs when available to ensure long-term accessibility. Document any data transformations or processing steps you applied to original datasets. List temporal coverage and spatial resolution specifications that affect interpretation of your cartographic outputs.
Explaining Cartographic Decision-Making Process
Justify your visualization choices through clear documentation of design reasoning and technical constraints. Explain classification methods you selected for choropleth maps, including break point determinations and statistical approaches. Record color palette decisions and accessibility considerations that influenced your design process. Document projection choices and coordinate system specifications that affect spatial accuracy. Include rationale for symbol sizing, legend placement, and labeling hierarchy decisions that impact map readability and user comprehension.
Protecting Privacy and Confidential Information
Privacy protection in cartography requires balancing public benefit with individual confidentiality. Your mapping decisions directly impact personal security and data protection standards.
Safeguarding Personal Location Data
Aggregate individual data points to prevent identification of specific households or businesses in your visualizations. Remove or generalize GPS coordinates that could reveal sensitive locations like homes or private facilities. Implement spatial buffering techniques that shift exact coordinates by 100-500 meters while maintaining analytical validity. Store raw location data on encrypted systems with restricted access protocols. Apply differential privacy methods when creating density maps to obscure individual contributors while preserving statistical patterns.
Anonymizing Sensitive Geographic Information
Strip identifying metadata from spatial datasets before publication including timestamps, device IDs, and user attributes. Use k-anonymity principles ensuring each data point represents at least five similar records in your geographic database. Replace precise addresses with census block groups or postal codes for demographic mapping projects. Implement data masking techniques that substitute real place names with generic identifiers in sensitive areas. Remove elevation data and building footprints that could enable precise location reconstruction from your published maps.
Balancing Public Interest with Individual Privacy
Assess disclosure risks against societal benefits when mapping health data, crime statistics, or economic indicators in your community projects. Consult with data protection officers and legal teams before publishing maps containing potentially sensitive information. Apply graduated disclosure methods showing broad patterns at regional scales while restricting neighborhood-level details. Establish clear data retention policies that automatically delete personal identifiers after research completion. Create tiered access systems allowing researchers different permission levels based on their institutional review board approvals and confidentiality agreements.
Conclusion
As a map user you now have the tools to critically evaluate cartographic representations and recognize their profound influence on public understanding. These six ethical principles serve as your framework for distinguishing between responsible mapping practices and those that may inadvertently perpetuate bias or misinformation.
Your awareness of these standards empowers you to demand better from the maps you encounter daily. Whether you’re viewing climate data online or using navigation apps you can assess whether cartographers have prioritized accuracy cultural sensitivity and inclusive design.
The responsibility for ethical mapping extends beyond professional cartographers to include you as an informed consumer of geographic information. By applying these principles you contribute to a more equitable and truthful representation of our world’s complex spatial relationships.
Frequently Asked Questions
What are the core ethical principles in cartography?
The six core ethical principles in cartography include truthfulness, inclusivity, accountability, accuracy, cultural sensitivity, and transparency. These principles guide cartographers in creating maps that fairly represent communities, avoid biased visualizations, and ensure data integrity. Understanding these principles helps users critically assess maps and recognize how data representation can influence equity and potentially reinforce societal biases.
How do maps influence public perception and policy decisions?
Maps significantly shape how people understand spatial relationships and social issues. Cartographic choices like color schemes, classification methods, and scale can emphasize or downplay certain information, potentially reinforcing stereotypes or inequality. These visual representations often influence public opinion and policy decisions, making it crucial for cartographers to consider the ethical implications of their design choices.
Why is accuracy important in geographic data representation?
Accuracy ensures maps provide credible and reliable information for decision-making. Systematic verification processes, including evaluating data sources, validating coordinates, and documenting data lineage, are essential for maintaining trustworthy geographic representations. Inaccurate maps can lead to poor policy decisions, misallocation of resources, and loss of public trust in cartographic products.
What role does cultural sensitivity play in ethical mapping?
Cultural sensitivity acknowledges that maps are cultural documents that can honor or erase indigenous heritage. Ethical mapping requires including indigenous place names, protecting sacred locations, and consulting with local communities throughout the mapping process. This approach ensures cultural accuracy, respects indigenous rights, and provides historical context that colonial-only designations often overlook.
How can maps be made more accessible to users with disabilities?
Accessible maps require inclusive design principles that accommodate diverse abilities. Key considerations include providing alternative text descriptions, maintaining proper contrast standards, ensuring screen reader compatibility, and using patterns or textures alongside color coding. Universal design principles help create maps usable by the widest range of individuals without requiring specialized adaptations.
Why is transparency important in cartographic methodology?
Transparency builds trust between cartographers and map users by documenting data collection methods, citing original sources, and explaining decision-making processes. This openness allows audiences to evaluate the reliability and limitations of geographic representations. Transparent methodology includes sharing GPS accuracy details, survey dates, visualization rationales, and any constraints encountered during data gathering.
How should cartographers protect privacy while maintaining public benefit?
Privacy protection requires balancing public interest with individual confidentiality through techniques like data aggregation, spatial buffering, and anonymization. Cartographers should implement k-anonymity principles, assess disclosure risks, and use graduated disclosure methods. Clear data retention policies and metadata stripping help protect sensitive location information while preserving the map’s utility for societal benefit.
What are the consequences of biased cartographic choices?
Biased cartographic choices can perpetuate stereotypes, marginalize communities, and influence public perception unfairly. Poor color selection, inappropriate classification methods, or misleading scale representations can create false emphasis or hide important information. These biases can affect resource allocation, policy decisions, and social equity, highlighting the significant responsibility cartographers bear in their visualization choices.