6 Best Map Scale Communication Methods
You’re staring at a map but can’t tell if that hiking trail is two miles or twenty miles away. Map scale confusion kills outdoor adventures and derails professional projects faster than you’d think.
The fix is simpler than you imagine. Six proven communication methods can transform how you read understand and share spatial information with others.
Master these techniques and you’ll never second-guess distances on maps again.
Disclosure: As an Amazon Associate, this site earns from qualifying purchases. Thank you!
P.S. check out Udemy’s GIS, Mapping & Remote Sensing courses on sale here…
Understanding Map Scale Fundamentals Before Communication
Before you can effectively communicate scale concepts to others, you need to master the fundamental principles that govern how maps represent real-world distances.
Definition and Types of Map Scales
Map scale represents the ratio between distances on your map and corresponding distances in reality. You’ll encounter three primary scale types: verbal scales (like “one inch equals one mile”), representative fraction scales (such as 1:24,000), and graphic bar scales that show distance measurements visually. Large-scale maps like 1:1,200 display small areas with high detail, while small-scale maps such as 1:1,000,000 cover vast regions with less precision. Understanding these distinctions helps you choose appropriate scales for different mapping projects and communication needs.
Why Scale Communication Matters in Mapping
Effective scale communication prevents costly measurement errors and ensures accurate spatial analysis across your mapping projects. When team members misinterpret scale relationships, field surveys become inaccurate, construction projects face delays, and emergency response efforts suffer from poor coordinate translation. Clear scale communication becomes critical when you’re working with multiple data sources at different scales, conducting GIS analysis requiring precise measurements, or training field crews who rely on map-based navigation. Professional cartographers recognize that scale miscommunication often causes more project failures than technical software issues.
Using Visual Scale Bars for Immediate Comprehension
Visual scale bars eliminate the guesswork from distance measurement by providing instant reference points that users can apply immediately to any map feature.
Creating Clear Graphical Scale Representations
Design your scale bars with high contrast colors against the map background to ensure maximum visibility across different viewing conditions. Choose simple geometric shapes like rectangles or lines rather than decorative elements that might confuse users. Include multiple unit divisions on your scale bar—typically showing both large increments (miles or kilometers) and smaller subdivisions (feet or meters) to accommodate various measurement needs. Position numerical labels clearly above or below each division mark, using readable fonts that maintain legibility when maps are reduced in size for printing or digital display.
Positioning Scale Bars for Maximum Impact
Place scale bars in consistent locations where users naturally expect to find them, typically in the lower-left or lower-right corners of your map layout. Avoid positioning scale bars over critical map features like roads, landmarks, or dense data areas that might obscure the scale information. Consider your map’s intended use when selecting placement—field maps benefit from corner positioning for quick reference, while presentation maps might accommodate scale bars within white space or margin areas. Test your scale bar visibility across different output formats including print, digital displays, and mobile devices to ensure consistent readability.
Implementing Representative Fraction Methods
Representative fractions provide the most mathematically precise way to communicate map scale relationships. You’ll find these numerical ratios essential for technical mapping projects requiring exact measurements.
Converting Between Different Scale Formats
Converting representative fractions to other formats requires simple mathematical operations. Transform a 1:50,000 scale to verbal format by stating “one inch equals 50,000 inches on the ground” or approximately 0.79 miles. Create graphic scale bars by dividing your chosen ground distance by the representative fraction denominator. Convert verbal scales to representative fractions by expressing both map and ground units in identical measurements, then simplifying the resulting ratio.
When to Use Numerical Scale Ratios
Use representative fraction methods when precision matters most in your mapping projects. Engineering surveys, construction drawings, and legal boundary maps require exact scale communication that numerical ratios provide. Choose this format for international projects since RF scales eliminate unit conversion confusion. Technical audiences including surveyors, engineers, and GIS professionals prefer representative fractions for their mathematical clarity and universal applicability across measurement systems.
Applying Verbal Scale Descriptions for Clarity
Verbal scale descriptions translate numerical ratios into everyday language that stakeholders can immediately understand. You’ll communicate spatial relationships more effectively when you express scales using familiar distance comparisons.
Writing Effective Scale Statements
Craft verbal statements using familiar distance references that your audience recognizes from daily experience. Express scales like “1 inch equals 1 mile” rather than complex ratios for general audiences. Include multiple unit options such as “1 centimeter represents 500 meters” alongside imperial measurements to accommodate diverse user needs. Test your verbal descriptions by asking colleagues to estimate distances using only your written scale statement.
Combining Verbal and Visual Elements
Integrate written scale descriptions directly with graphic scale bars to reinforce spatial understanding through multiple communication channels. Position verbal statements adjacent to visual scale elements rather than separating them across different map areas. Create redundant scale information by pairing descriptive text like “Quarter-mile intervals” with corresponding tick marks on your scale bar. This dual approach reduces interpretation errors when users switch between measuring tools and visual estimation methods.
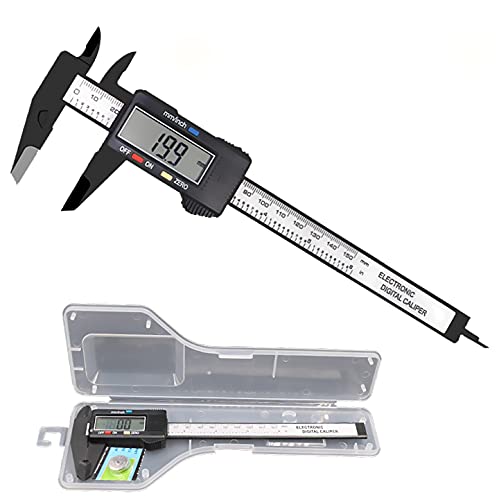
Get precise measurements with this digital caliper, featuring easy inch/millimeter conversion and a clear LCD display. Measure inner/outer diameters, depths, and steps with accuracy, plus enjoy automatic shutoff for extended battery life.
Demonstrating Scale Through Comparative Examples
You’ll find that connecting abstract map scales to tangible references dramatically improves spatial understanding for your map users.
Using Familiar Objects for Size Reference
You can establish immediate scale comprehension by placing recognizable objects alongside your mapped features. Football fields work exceptionally well for urban planning maps at 1:2,400 scale, where one inch equals 200 feet. City blocks provide another reliable reference point, particularly when mapping downtown areas where standard blocks measure roughly 300 feet. Swimming pools offer perfect size context for residential neighborhood maps, helping viewers instantly grasp property boundaries and lot dimensions. These object comparisons eliminate guesswork and create mental anchors that make distance interpretation automatic rather than calculated.
Creating Relatable Distance Comparisons
You should translate your map measurements into walking times and driving distances that resonate with everyday experience. A quarter-mile distance becomes “a five-minute walk” or “the length of four city blocks” depending on your audience. Highway segments benefit from car-based references like “two freeway exits apart” or “a three-minute drive at highway speed.” Trail maps gain clarity when you describe distances as “15-minute hiking segments” rather than abstract measurements. These familiar comparisons bridge the gap between cartographic precision and practical understanding, making your maps immediately useful for navigation and planning decisions.
Utilizing Digital Interactive Scale Tools
Digital mapping platforms offer dynamic scale communication capabilities that traditional paper maps can’t match. These interactive tools automatically adjust scale representations based on user interactions and viewing contexts.
Implementing Zoom-Based Scale Communication
Zoom-based scale communication adapts scale indicators dynamically as users navigate through different map magnification levels. Modern GIS platforms like ArcGIS Online and QGIS automatically recalculate scale bars when you zoom in or out, maintaining accurate distance references at every zoom level. This approach eliminates scale confusion by providing real-time feedback about your current viewing scale. Configure your digital maps to display both numerical scales (1:24,000) and graphic scale bars simultaneously, ensuring users understand distance relationships regardless of their zoom level.
Integrating Real-Time Scale Updates
Real-time scale updates provide immediate feedback about spatial measurements as users interact with digital maps. Web mapping applications like Leaflet and OpenLayers can display live scale calculations when you hover over features or draw measurement lines. These tools show distance measurements in multiple units simultaneously, allowing users to see both metric and imperial measurements instantly. Implement dynamic scale widgets that update coordinate displays, area calculations, and linear measurements as users pan across different map projections, ensuring accurate spatial reference throughout their mapping session.
Employing Multiple Scale Communication Techniques Simultaneously
You’ll achieve optimal scale communication by strategically combining multiple methods rather than relying on a single approach. Professional cartographers consistently employ this layered strategy to accommodate diverse user needs and eliminate scale interpretation errors.
Layering Different Scale Methods
Layer representative fractions with graphic scale bars to provide both mathematical precision and visual reference points. Position your 1:24,000 ratio directly above a corresponding graphic bar showing miles and kilometers. Add verbal descriptions like “1 inch equals 2,000 feet” beneath visual elements to reinforce scale understanding across different learning preferences and technical backgrounds.
Ensuring Consistency Across All Methods
Verify mathematical alignment between all scale representations before finalizing your map design. Calculate distances using each method to confirm identical results – if your graphic bar shows 2 miles while your representative fraction calculates 2.1 miles, you’ve identified a critical consistency error. Cross-check verbal descriptions against numerical ratios and test all scale elements at intended print sizes.
Conclusion
Mastering these six map scale communication methods will transform how you share spatial information with others. You’ll eliminate confusion and build confidence in your mapping projects by implementing visual scale bars representative fractions and verbal descriptions effectively.
Remember that combining multiple techniques creates the strongest communication foundation. Your maps become more accessible when you layer different scale methods together while maintaining mathematical consistency across all representations.
Achieve a flawless, even complexion with e.l.f. Flawless Satin Foundation. This lightweight, vegan formula provides medium coverage and a semi-matte finish for all-day wear, while hydrating your skin with glycerin.

The digital tools and interactive elements you’ve learned about offer exciting opportunities to enhance traditional scale communication. You can now create dynamic mapping experiences that adapt to user needs and provide real-time feedback.
Your ability to connect abstract scales to familiar references will make your maps immediately useful for any audience. Whether you’re working on technical surveys or planning outdoor adventures you now have the tools to communicate scale information clearly and confidently.
Frequently Asked Questions
What is map scale and why is it important?
Map scale is the ratio between distances on a map and real-world distances. It’s crucial for accurate navigation, field surveys, construction projects, and emergency response. Understanding scale prevents costly measurement errors, ensures precise spatial analysis, and helps users correctly interpret distances for outdoor adventures and professional mapping projects.
What are the three main types of map scales?
The three primary types are verbal scales (written descriptions like “1 inch = 1 mile”), representative fraction scales (mathematical ratios like 1:24,000), and graphic bar scales (visual rulers on maps). Each type serves different purposes and user needs in communicating spatial relationships effectively.
How do I distinguish between large-scale and small-scale maps?
Large-scale maps show smaller areas with more detail (like 1:1,000), while small-scale maps cover larger areas with less detail (like 1:1,000,000). Think of it inversely: a larger scale number actually means a smaller scale map. This distinction helps select appropriate scales for different mapping projects.
What makes visual scale bars effective on maps?
Effective scale bars use high-contrast colors, simple geometric shapes, and multiple unit divisions for clarity. They should be positioned consistently in expected locations while avoiding critical map features. Proper scale bar design enhances immediate distance comprehension without cluttering the map’s primary information.
When should I use representative fraction methods?
Representative fractions are ideal for technical mapping projects requiring exact measurements, such as engineering surveys, construction drawings, and legal boundary maps. They provide mathematical precision and eliminate unit conversion confusion, making them preferred by technical audiences like surveyors and engineers who need accurate spatial references.
How can I make map scales more relatable to users?
Connect abstract scales to familiar references like football fields or city blocks. Translate measurements into everyday terms such as walking times or driving distances. Combine verbal descriptions with visual elements, and provide multiple unit options to accommodate diverse user needs and improve practical understanding.
What are the benefits of digital interactive scale tools?
Digital tools offer dynamic scale communication that adjusts automatically as users zoom in or out. They provide real-time scale updates, show measurements in multiple units simultaneously, and offer immediate feedback on spatial measurements. These capabilities surpass traditional paper maps in accuracy and user convenience.
Should I combine multiple scale communication methods?
Yes, layering different scale methods maximizes understanding and accommodates diverse user needs. Combine representative fractions with graphic scale bars and verbal descriptions to eliminate interpretation errors. Always ensure mathematical consistency across all scale representations to avoid critical measurement mistakes in your final map design.