
7 Color Palette Choices for Data Visualization That Create Visual Impact
The bottom line: Your data visualization’s success hinges on one crucial element most people overlook — color choice.
Poor color palettes can transform even the most insightful data into confusing noise that leaves your audience squinting at charts and questioning your findings. Smart color selection doesn’t just make your visualizations prettier — it guides attention highlights key insights and ensures your message cuts through the clutter.
Whether you’re presenting quarterly reports to executives or sharing research findings with colleagues you need color palettes that work across different audiences devices and accessibility requirements.
Disclosure: As an Amazon Associate, this site earns from qualifying purchases. Thank you!
P.S. check out Udemy’s GIS, Mapping & Remote Sensing courses on sale here…
Choose Sequential Color Palettes for Ordered Data
Sequential palettes excel when your data follows a natural progression from low to high values. These color schemes guide viewers through ordered data by using gradual transitions that make patterns immediately recognizable.
Single-Hue Sequential Palettes
Single-hue sequential palettes use varying intensities of one color to represent data ranges. Light blue to dark blue works perfectly for showing temperature variations across geographic regions. You’ll maintain visual consistency while clearly distinguishing between low and high values. These palettes reduce cognitive load since viewers intuitively understand that darker shades represent higher values. Popular single-hue options include light-to-dark progressions in blue, green, purple, or orange.
Multi-Hue Sequential Palettes
Multi-hue sequential palettes blend two or three related colors to create smooth transitions across your data range. Yellow-orange-red sequences effectively show heat intensity or density patterns. You’ll achieve greater visual distinction between data points compared to single-hue alternatives. ColorBrewer’s YlOrRd and Viridis palettes exemplify well-designed multi-hue progressions. These schemes prevent the visual flatness that sometimes occurs with single-color gradients while maintaining clear sequential ordering.
Best Use Cases for Sequential Schemes
Sequential schemes work best for continuous data like population density, elevation maps, sales performance, or temperature readings. You’ll want these palettes when showing progression from absence to presence of a phenomenon. Heat maps, choropleth maps, and bar charts with ordered categories benefit most from sequential color choices. Avoid sequential palettes for categorical data where no natural ordering exists, such as different product types or geographic regions without hierarchical relationships.
Choose Diverging Color Palettes for Comparative Analysis
Diverging color palettes excel when you need to visualize data that deviates from a central point, with two distinct extremes representing opposite values or conditions.
Red-White-Blue Diverging Schemes
Red-white-blue schemes provide intuitive visualization for political data, temperature variations, and performance metrics. The white center represents neutral values while red and blue endpoints indicate opposing extremes. You’ll find these palettes particularly effective for election results, where red traditionally represents conservative values and blue represents liberal positions. Temperature maps also benefit from this approach, with red showing heat and blue indicating cold zones.
Orange-White-Purple Combinations
Orange-white-purple combinations offer excellent contrast while remaining colorblind-friendly for most viewers. These schemes work exceptionally well for correlation matrices, survey responses, and scientific data where you need clear distinction between positive and negative values. The warm orange tones naturally draw attention to one extreme while cool purple shades highlight the opposite end. You can adjust saturation levels to create subtle gradations that maintain readability across different display devices.
When to Apply Diverging Palettes
Apply diverging palettes when your data contains a meaningful center point or baseline value that serves as a natural reference. Financial performance data, statistical correlations, and deviation analyses benefit most from this approach. Avoid diverging schemes for purely categorical data or measurements that don’t have logical opposing extremes. Your audience should immediately understand that the center represents neutrality while the endpoints indicate contrasting conditions or values.
Choose Qualitative Color Palettes for Categorical Data
Qualitative color palettes excel at distinguishing between distinct categories that lack inherent order or hierarchy. You’ll achieve maximum clarity when each category appears equally important and visually distinct.
High-Contrast Category Colors
Maximize distinction between categories by selecting colors with sufficient contrast ratios. You’ll want to use colors that differ significantly in hue rather than just lightness or saturation. Primary colors like red, blue, and yellow work well together, while adding green and orange extends your categorical options. Avoid colors that blend together, such as light blue and light green, which can confuse viewers when displayed side by side.
Color-Blind Friendly Qualitative Options
Implement colorblind-accessible palettes using tools like ColorBrewer or Viz Palette to ensure your visualizations remain clear for all viewers. You’ll find that blue-orange combinations work exceptionally well, as they’re distinguishable across most types of color vision deficiency. Consider using different shapes or patterns alongside colors to provide additional visual cues. The Viridis palette family offers excellent colorblind-friendly options that maintain distinctiveness across multiple categories.
Balancing Visual Weight Across Categories
Ensure equal visual prominence by selecting colors with similar saturation and brightness levels across all categories. You’ll prevent certain categories from dominating the visualization when each color carries equivalent visual weight. Avoid pairing bright, saturated colors with muted tones unless you intentionally want to emphasize specific categories. Test your palette by converting it to grayscale to verify that all categories remain distinguishable and no single color overwhelms the others.
Choose Monochromatic Color Palettes for Subtle Differentiation
Monochromatic schemes offer elegant simplicity while maintaining clear visual hierarchy in your data visualizations. These palettes work exceptionally well when you need subtle differentiation without overwhelming your audience.
Single Color with Varying Saturation
Single-color palettes excel when you’re working with continuous data that requires gentle transitions between values. You’ll achieve optimal results by selecting one base hue and adjusting its saturation from light to intense. For example, use pale blue (#E3F2FD) to deep navy (#0D47A1) for temperature data or financial performance metrics. This approach reduces cognitive load while maintaining clear value distinctions across your dataset.
Tonal Variations Within One Hue
Tonal variations provide sophisticated depth by manipulating brightness levels within your chosen color family. You can create compelling visualizations by shifting from light tints to dark shades of the same hue. Green palettes work particularly well for environmental data, progressing from mint (#F1F8E9) to forest green (#1B5E20). This technique ensures accessibility compliance while delivering professional-grade visual appeal that resonates with diverse audiences.
Creating Hierarchy with Monochromatic Schemes
Hierarchy emerges naturally when you strategically assign color intensity to data importance levels. You’ll guide viewers’ attention by placing darker, more saturated colors on critical data points while using lighter tones for supporting information. Primary insights should receive the deepest color values, secondary data gets medium saturation, and background elements use the lightest tints. This systematic approach creates intuitive visual flow that enhances comprehension across executive dashboards and technical reports.
Choose Analogous Color Palettes for Harmonious Displays
Analogous color palettes create naturally pleasing visualizations by using colors that sit next to each other on the color wheel. You’ll achieve visual harmony while maintaining enough contrast to distinguish between data points effectively.
Adjacent Colors on the Color Wheel
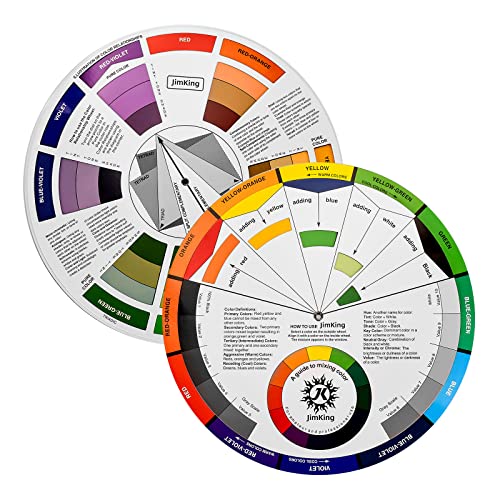
Easily organize and understand color relationships with this rotating color wheel. Ideal for artists and designers, it features a durable, UV-coated design for lasting use and clear color identification.
Adjacent colors create smooth transitions that guide your viewer’s eye naturally across your visualization. You can select three to four neighboring hues like blue-green-yellow or red-orange-yellow for cohesive displays. These combinations work exceptionally well for geographic heat maps and trend analyses where you need gradual progression. Your data flows seamlessly when you choose colors that naturally blend together, reducing cognitive load for your audience.
Warm Analogous Combinations
Warm analogous palettes using reds, oranges, and yellows create energetic visualizations perfect for highlighting growth data and positive trends. You’ll find these combinations particularly effective for financial dashboards showing revenue increases or population growth maps. Orange-red-pink schemes work well for temperature data and sales performance metrics. These warm palettes naturally draw attention and convey urgency, making them ideal when you need to emphasize important business metrics or critical data points.
Cool Analogous Color Schemes
Cool analogous schemes featuring blues, greens, and purples provide calming visualizations ideal for environmental data and analytical reports. You can use blue-teal-green combinations for water quality studies or ocean temperature mapping. These palettes excel in scientific visualizations where you need to present complex data without overwhelming your audience. Purple-blue-cyan schemes work particularly well for nighttime data visualizations and technology-focused dashboards, creating professional presentations that maintain viewer focus on analytical insights.
Choose Complementary Color Palettes for Maximum Contrast
Complementary color palettes deliver the highest visual contrast by positioning colors directly opposite each other on the color wheel. You’ll achieve maximum differentiation between data categories when you strategically apply these high-contrast combinations.
Direct Complementary Pairings
Direct Complementary Pairings create the strongest visual impact by using colors positioned 180 degrees apart on the color wheel. You’ll find red-green and blue-orange combinations particularly effective for binary comparisons like profit versus loss or before versus after scenarios. These pairings demand attention and clearly separate opposing categories, making them ideal for dashboard alerts and performance indicators. However, you should test these combinations for colorblind accessibility since red-green pairings can become indistinguishable for users with color vision deficiencies.
Split-Complementary Variations
Split-Complementary Variations offer vibrant contrast while maintaining visual harmony by combining one base color with the two colors adjacent to its complement. You can use blue with red-orange and yellow-orange to create dynamic yet balanced visualizations that avoid the harsh tension of direct complements. These schemes work exceptionally well for three-category data where you need clear distinction without overwhelming contrast. The softer approach reduces eye strain while preserving the visual separation necessary for effective data interpretation across extended viewing sessions.
Triadic Color Combinations
Triadic Color Combinations employ three colors evenly spaced around the color wheel to create balanced yet vibrant visualizations with strong contrast. You’ll achieve optimal results with red-blue-yellow or orange-green-purple schemes when presenting three distinct data categories of equal importance. These combinations ensure each category receives equal visual weight while maintaining clear differentiation across your visualization. The balanced spacing prevents any single color from dominating the display, making triadic schemes perfect for demographic breakdowns and market segment analyses.
Choose Custom Brand Color Palettes for Consistent Identity
Your brand colors become powerful visual anchors when thoughtfully integrated into data visualizations. Custom brand palettes ensure your charts maintain corporate identity while delivering clear insights.
Incorporating Corporate Colors
Start with your primary brand colors as the foundation for your visualization palette. Extract hex codes from your brand guidelines and test them across different chart types to ensure readability. Use your dominant brand color for the most important data series while relegating secondary brand colors to supporting elements like backgrounds or less critical data points. Consider creating light and dark variations of your core colors to expand your palette options without losing brand consistency.
Achieve a flawless, even complexion with e.l.f. Flawless Satin Foundation. This lightweight, vegan formula provides medium coverage and a semi-matte finish for all-day wear, while hydrating your skin with glycerin.

Extending Brand Palettes for Data
Build extended color families by adjusting saturation and brightness levels of your existing brand colors. Create tonal variations that maintain your brand’s visual DNA while providing enough contrast for effective data differentiation. Develop complementary colors that harmonize with your brand palette using color theory principles. Test these extended palettes with colorblind simulation tools to ensure accessibility. Document your expanded palette with specific hex codes and usage guidelines for consistent application across different visualization types.
Maintaining Brand Recognition in Charts
Apply your brand colors strategically to reinforce visual identity without compromising data clarity. Use your primary brand color for key metrics or call-to-action data points that align with business priorities. Incorporate brand colors in chart elements like headers, legends, and annotations rather than forcing them into every data series. Balance brand consistency with visualization best practices by reserving your brightest brand colors for highlighting critical insights. Create template guidelines that specify when to prioritize brand colors versus optimal data visualization colors.
Conclusion
You’ve now got seven powerful color palette strategies that’ll transform your data visualizations from confusing charts into clear compelling stories. Each palette type serves a specific purpose – whether you’re showing progression with sequential colors or highlighting differences with complementary schemes.
Remember that your color choices directly impact how your audience interprets and trusts your data. Test your palettes for accessibility and make sure they work across different devices and formats.
The best color palette is the one that makes your data’s story impossible to miss. Start with your data’s structure then choose the palette that naturally guides your viewers to the insights that matter most.
Frequently Asked Questions
Why is color choice important in data visualization?
Color choice is crucial because poor color palettes can obscure insights and confuse audiences. Effective color selection enhances aesthetic appeal, directs attention to key insights, and ensures clear message communication. The right colors make visualizations accessible across different devices and audiences while maintaining clarity in executive reports and research presentations.
What are sequential color palettes and when should I use them?
Sequential color palettes use ordered progressions from light to dark values, perfect for continuous data like temperature or population density. Single-hue palettes maintain visual consistency, while multi-hue combinations create smoother transitions. Use them for data with natural ordering, but avoid them for categorical data without inherent hierarchy.
When are diverging color palettes most effective?
Diverging palettes work best for data that deviates from a central point, showing two distinct extremes. Red-white-blue schemes excel for political data and temperature variations, while orange-white-purple combinations are colorblind-friendly for correlation matrices. Apply them when there’s a meaningful center point or baseline in your data.
How do I choose colors for categorical data?
Use qualitative color palettes with high-contrast colors to maximize distinction between categories. Select primary colors with similar saturation and brightness levels to ensure equal visual weight. Consider colorblind-friendly options like blue-orange combinations, and test your palette in grayscale to maintain distinguishability across all categories.
What are the benefits of monochromatic color palettes?
Monochromatic palettes offer elegant simplicity and clear visual hierarchy using variations of a single color. They work excellently for continuous data with gentle transitions and create depth through tonal variations. These palettes are particularly effective for environmental data and help guide viewers’ attention by strategically assigning color intensity based on data importance.
When should I use analogous color schemes?
Analogous color palettes use adjacent colors on the color wheel, creating naturally pleasing visualizations with smooth transitions. They’re ideal for geographic heat maps and trend analyses. Warm combinations (reds, oranges, yellows) highlight growth data, while cool schemes (blues, greens, purples) work well for environmental data and analytical reports.
How do complementary colors enhance data visualization?
Complementary colors sit opposite on the color wheel, delivering maximum visual contrast for binary comparisons. Direct pairings like red-green create strong impact, while split-complementary variations maintain harmony with vibrant contrast. Triadic combinations use three evenly spaced colors for balanced visualizations, perfect for demographic breakdowns and market segments.
How can I incorporate brand colors into data visualizations?
Start with primary brand colors as your foundation and test them across different chart types for readability. Create light and dark variations of core colors, then extend the palette by adjusting saturation and brightness. Apply brand colors strategically to key metrics, headers, and legends while developing template guidelines for consistency.