5 Best Digital Map Features for Geographic Understanding
The big picture: Scale isn’t just about making maps bigger or smallerâit’s the secret weapon that transforms how you interpret geographic features and spatial relationships.
Why it matters: The scale you choose determines which details pop and which fade away making it one of the most powerful tools in a cartographer’s arsenal for storytelling through maps.
What’s ahead: Understanding how scale emphasizes different features will help you read maps more effectively and appreciate the strategic decisions behind every cartographic design.
Disclosure: As an Amazon Associate, this site earns from qualifying purchases. Thank you!
P.S. check out Udemy’s GIS, Mapping & Remote Sensing courses on sale here…
Understanding Scale as a Fundamental Cartographic Tool
Scale forms the backbone of every cartographic decision you’ll make. It determines which geographic features become visible, which spatial relationships emerge, and how effectively your map communicates its intended message.
Definition of Scale in Map Making
Scale represents the proportional relationship between distances on your map and corresponding distances on Earth’s surface. You’ll encounter scale expressed as ratios (1:24,000), representative fractions, or verbal statements like “one inch equals one mile.” This mathematical relationship controls how much geographic area fits within your map boundaries. Understanding scale ratios helps you calculate real-world distances and areas from map measurements. Small-scale maps (1:1,000,000) cover large areas with less detail, while large-scale maps (1:24,000) show smaller areas with greater precision.
Types of Scale Representation
Graphic scales provide visual bars showing distance measurements that remain accurate even when maps are enlarged or reduced. Verbal scales use written statements describing the relationship between map and ground distances. Representative fraction scales express the ratio mathematically, where 1:50,000 means one unit on the map equals 50,000 units on the ground. You’ll find graphic scales most useful for field work since they adjust automatically with map reproductions. Digital mapping platforms often combine multiple scale representations, allowing users to switch between formats based on their needs.
The Relationship Between Scale and Geographic Detail
Large-scale maps reveal intricate details like individual buildings, property boundaries, and local topographic features that disappear at smaller scales. Medium-scale maps balance regional context with local detail, showing cities, major roads, and significant landforms. Small-scale maps emphasize broad patterns, continental features, and global relationships while generalizing local details. Your choice of scale determines which geographic phenomena become visible and which get filtered out through cartographic generalization. This relationship between scale and detail drives the hierarchy of information displayed on your finished map.
Enhancing Topographic Features Through Large-Scale Mapping
Large-scale maps transform your ability to showcase terrain complexity and elevation patterns. They’re your primary tool for revealing the subtle geographic details that define local landscapes.
Revealing Elevation Changes and Terrain Details
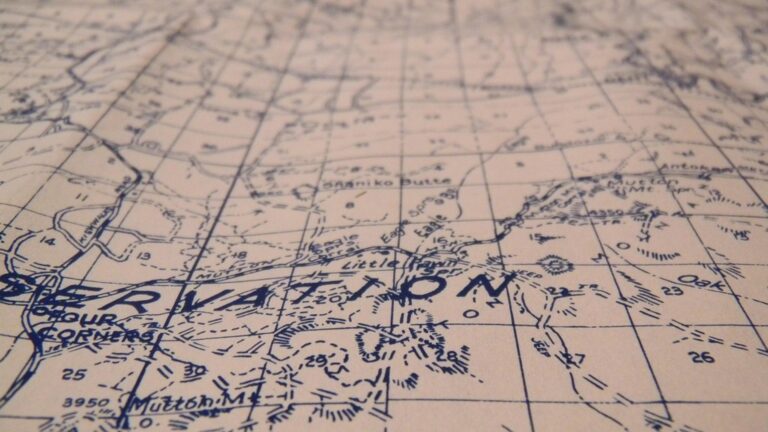
Large-scale mapping reveals contour line density that highlights steep slopes and elevation transitions. You’ll capture ridge lines, valley floors, and drainage patterns with precise detail when working at scales of 1:24,000 or larger. These scales allow you to display elevation changes as small as 10-20 feet, making terrain features visible that disappear on smaller-scale maps. Your contour intervals can showcase micro-topography including stream channels, small hills, and local depressions.
Highlighting Natural Landforms and Physical Geography
Natural landforms emerge with distinctive clarity through large-scale cartographic representation. You can emphasize rock outcrops, wetland boundaries, and forest edges with specific symbology that remains legible at detailed scales. Large-scale maps allow you to differentiate between landform types like alluvial fans, terraces, and escarpments using targeted colors and patterns. Physical geography features including springs, caves, and unique geological formations become mappable elements rather than generalized symbols.
Showcasing Local Geographic Variations
Local geographic variations gain prominence when you employ large-scale mapping techniques for community-level analysis. You’ll capture neighborhood elevation differences, local watershed boundaries, and microclimatic zones that influence land use patterns. Large-scale maps reveal property-level topographic features including drainage ditches, small ponds, and elevation-based zoning restrictions. These variations help you illustrate how terrain influences development patterns, agricultural practices, and infrastructure placement within confined geographic areas.
Magnifying Urban Infrastructure and Human-Made Features
Large-scale mapping transforms your ability to represent the built environment with exceptional detail. Urban infrastructure elements that disappear at smaller scales become prominent features that reveal the complexity of human development patterns.
Displaying Building Footprints and Street Networks
Building footprints emerge as distinct polygons at scales of 1:10,000 or larger, allowing you to map individual structures with precise dimensional accuracy. Street networks expand from simple line features to detailed representations showing lane widths, sidewalks, and intersection geometry. You’ll capture parking areas, building setbacks, and architectural footprints that reveal urban density patterns and development chronology within neighborhoods.
Emphasizing Transportation Systems and Public Facilities
Transportation infrastructure gains remarkable definition when you work at large scales, revealing multi-modal networks including bike lanes, bus routes, and pedestrian pathways. Public facilities like schools, hospitals, and municipal buildings become identifiable landmarks with accurate spatial relationships. You’ll map transit stops, traffic control devices, and accessibility features that demonstrate how communities connect through their transportation systems.
Capturing Neighborhood Boundaries and Zoning Details
Zoning boundaries become precisely mappable elements at large scales, showing property lines, setback requirements, and land use classifications with survey-grade accuracy. Neighborhood boundaries shift from generalized areas to specific street-by-street delineations that reflect actual community organization. You’ll document mixed-use zones, historic districts, and overlay zones that influence development patterns and reveal the regulatory framework shaping urban growth.
Amplifying Natural Resource Distribution Patterns
Scale amplifies natural resource distribution patterns across landscapes, revealing critical data for environmental management and resource extraction planning.
Illustrating Water Bodies and Hydrographic Networks
Large-scale mapping transforms water feature representation from simplified blue lines into comprehensive hydrographic networks. You’ll capture stream order classifications, wetland boundaries, and watershed delineations at scales of 1:24,000 or larger. Tributary systems become visible with accurate flow directions, while seasonal water bodies and ephemeral streams gain proper documentation. Digital elevation models combined with large-scale hydrographic data reveal flood zones and drainage basin characteristics essential for water resource management.
Mapping Vegetation Coverage and Land Use Types
Detailed scale mapping differentiates forest canopy density, agricultural crop types, and grassland compositions across specific parcels. You’ll identify deciduous versus coniferous coverage, irrigated versus rain-fed agriculture, and urban green space distributions at parcel-level accuracy. Land use classifications become precise enough for zoning compliance and environmental impact assessments. Seasonal vegetation patterns and succession stages become mappable features, supporting habitat management and conservation planning with field-verified accuracy.
Demonstrating Geological Formations and Mineral Deposits
Large-scale geological mapping reveals bedrock exposures, fault systems, and mineral occurrence patterns invisible on regional maps. You’ll document outcrop locations, structural geology features, and ore deposit boundaries with survey-grade precision. Stratigraphic relationships become clear through detailed cross-sectional capabilities, while soil composition variations support agricultural and construction planning. Hydrogeological features like aquifer boundaries and groundwater flow patterns gain spatial definition essential for water well placement and contamination studies.
Clarifying Spatial Relationships Between Geographic Elements
Scale transforms how you perceive and measure the connections between geographic features. The relationship between map scale and spatial analysis determines which geographic patterns become visible and measurable.
Showing Proximity and Distance Measurements
Large-scale maps enable precise distance calculations between geographic features using tools like measuring wheels or digital GIS analysis. At 1:10,000 scale you can accurately measure distances between buildings within 2-3 feet while identifying walking routes and accessibility corridors. Small-scale maps at 1:250,000 reveal regional connectivity patterns showing highway networks spanning multiple counties and flight paths connecting metropolitan areas across states.
Measure distances accurately with this durable wheel, featuring a one-key reset and collapsible design for easy portability. Ideal for indoor and outdoor projects, it measures up to 9,999 feet with ±0.5% accuracy.

Revealing Connectivity and Accessibility Patterns
Transportation networks display different connectivity levels depending on your chosen scale parameters. Large-scale mapping at 1:5,000 shows pedestrian pathways connecting residential areas to commercial districts including crosswalks and bike lanes. Regional scales at 1:500,000 emphasize interstate highway systems and rail corridors that link major economic centers while highlighting gaps in rural transportation infrastructure and isolated communities.
Demonstrating Scale-Dependent Geographic Phenomena
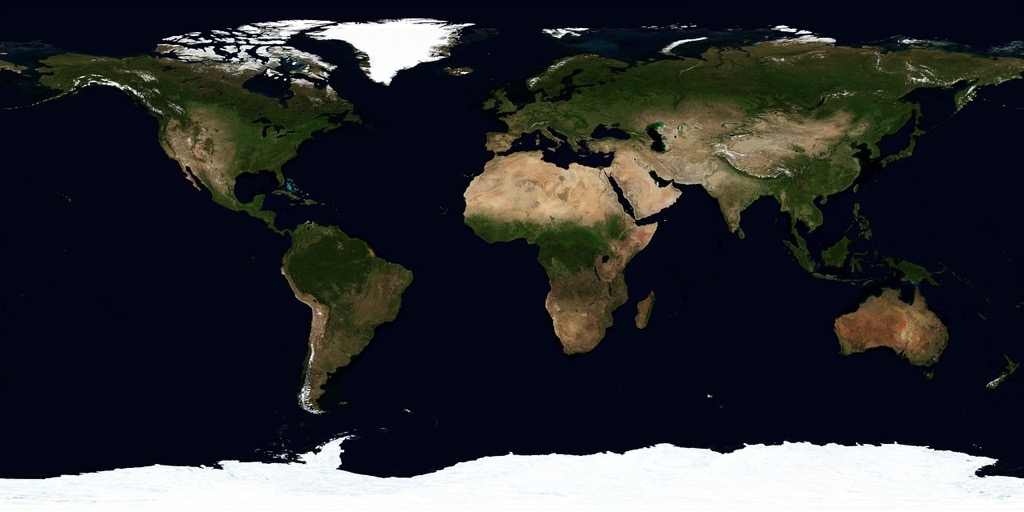
Geographic processes manifest differently across scale ranges requiring careful consideration of phenomenon visibility thresholds. Watershed boundaries appear as simple lines on small-scale maps but reveal complex drainage networks and tributary systems at 1:24,000 scale. Urban heat island effects become visible through temperature mapping at neighborhood scales while climate patterns require continental-scale representation at 1:10,000,000 to show regional temperature gradients.
Conclusion
Scale serves as your most powerful ally in cartographic storytelling. When you understand how different scales emphasize various geographic features you’ll make more strategic mapping decisions that enhance communication effectiveness.
Your choice of scale determines whether viewers focus on intricate local details or broader regional patterns. Large-scale maps reveal the complexity of terrain elevation and urban infrastructure while small-scale maps highlight connectivity and spatial relationships across vast areas.
Mastering scale relationships empowers you to create maps that serve their intended purpose. Whether you’re mapping natural resources geological formations or transportation networks the scale you select will ultimately define what story your map tells and how effectively it reaches your audience.
Frequently Asked Questions
What is scale in cartography?
Scale in cartography refers to the proportional relationship between distances on a map and corresponding distances on Earth’s surface. It’s expressed through ratios, representative fractions, or verbal statements. Scale determines which geographic features become visible and how effectively a map communicates its intended message, making it a fundamental element in cartographic design.
How does scale affect the level of detail shown on maps?
Large-scale maps (like 1:10,000) reveal intricate details such as individual buildings and street features, while small-scale maps (like 1:100,000) emphasize broader patterns and generalize local features. The choice of scale creates a hierarchy of information, determining which geographic elements are highlighted or obscured in the final map presentation.
What are the different types of scale representation?
The three main types of scale representation are graphic scales (visual bar scales), verbal scales (written statements like “1 inch equals 1 mile”), and representative fraction scales (numerical ratios like 1:24,000). Each format serves different purposes in both fieldwork and digital mapping applications, providing flexibility for various user needs.
What advantages do large-scale maps offer for terrain mapping?
Large-scale maps excel at showcasing terrain complexity and elevation patterns through dense contour lines. At scales of 1:24,000 or larger, they can capture elevation changes as small as 10-20 feet, revealing subtle geographic details like ridge lines, valley floors, and drainage patterns that are often lost on smaller-scale maps.
How does large-scale mapping improve urban infrastructure representation?
At scales of 1:10,000 or larger, large-scale mapping transforms urban representation by showing building footprints as distinct polygons, revealing detailed street features like lane widths and sidewalks, and displaying transportation networks with clarity. Public facilities become identifiable landmarks, and zoning boundaries are mapped with survey-grade accuracy.
Why is scale important for natural resource mapping?
Scale is crucial for natural resource mapping because it determines the level of detail visible for resource distribution patterns. Large-scale mapping can differentiate vegetation types, reveal detailed hydrographic networks with stream classifications, and show geological features like bedrock exposures and fault systems essential for environmental management and resource extraction planning.
How does scale affect spatial relationship measurements?
Scale transforms how we perceive and measure spatial relationships between geographic elements. Large-scale maps allow precise distance calculations between features and reveal detailed connectivity patterns like pedestrian pathways, while small-scale maps highlight broader regional connections such as highway systems and interstate commerce routes.