7 Best Map Design Principles
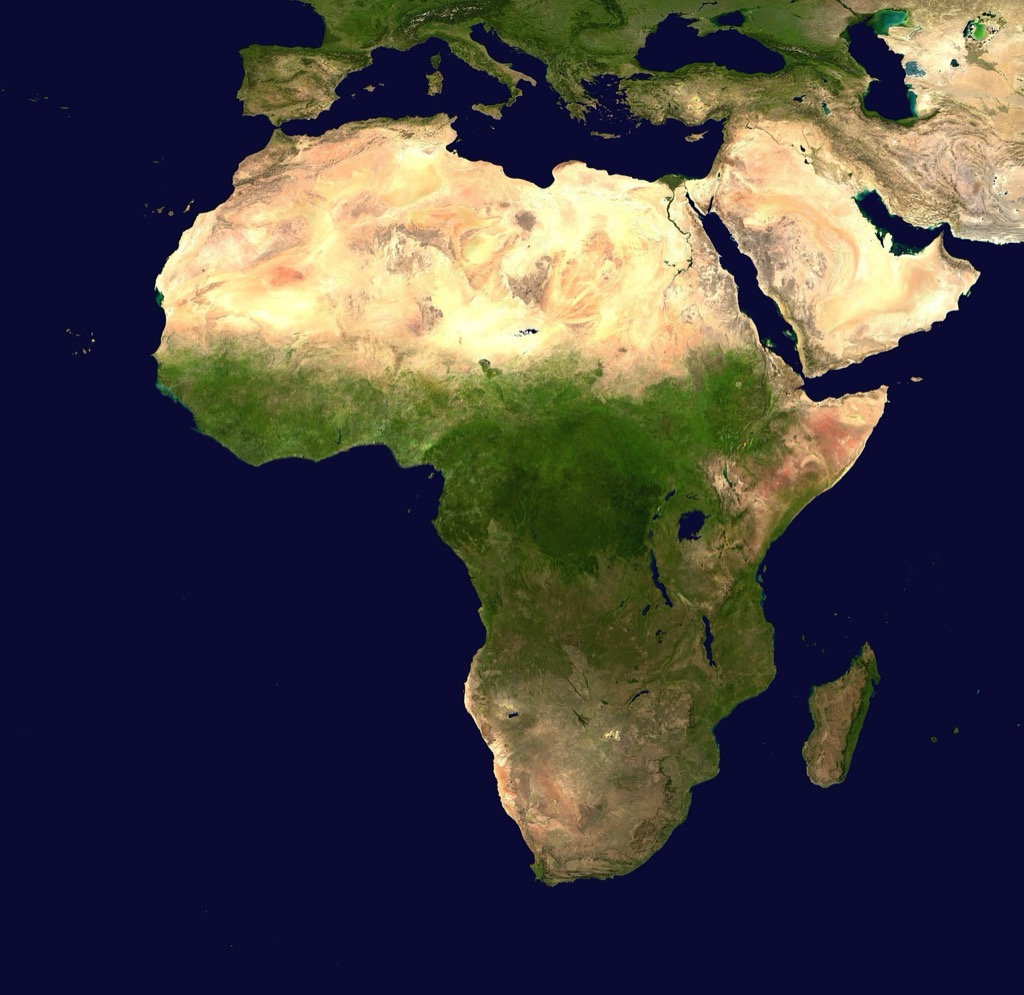
Why it matters: Satellite imagery has transformed how we visualize and understand our world but poor map design can render even the most stunning data completely useless to your audience.
The big picture: Whether you’re presenting environmental changes to stakeholders or showcasing urban development patterns you need strategic design principles that transform raw satellite data into compelling visual stories that actually communicate your message.
What’s next: These seven creative map design principles will help you create satellite image presentations that not only capture attention but also deliver clear actionable insights to any audience.
Disclosure: As an Amazon Associate, this site earns from qualifying purchases. Thank you!
P.S. check out Udemy’s GIS, Mapping & Remote Sensing courses on sale here…
Establish Clear Visual Hierarchy Through Strategic Color Contrast
Color contrast serves as your primary tool for directing viewer attention across satellite imagery. Strategic color selection transforms complex geospatial data into intuitive visual narratives that communicate your mapping objectives effectively.
Use High-Contrast Color Palettes for Enhanced Readability
Select complementary colors that create maximum visual separation between data layers. Use dark blues (#1f3a93) against bright yellows (#ffeb3b) for land-water boundaries, or deep greens (#2e7d32) with orange (#ff6f00) for vegetation-urban transitions. Avoid low-contrast combinations like light blue on white backgrounds, which reduce readability at standard viewing distances. Test your palette using colorbrewer2.org to ensure accessibility standards and verify contrast ratios exceed 4.5:1 for text elements.
Apply Graduated Color Schemes to Show Data Relationships
Implement sequential color ramps that reveal data patterns through logical color progression. Use single-hue gradients from light to dark for elevation data, progressing from pale yellow (#fff59d) to deep brown (#3e2723) for terrain visualization. Apply diverging schemes with neutral midpoints for temperature anomalies or change detection, utilizing blue-white-red progressions that highlight deviations from baseline conditions. ColorBrewer’s sequential and diverging palettes provide scientifically-tested combinations optimized for satellite data visualization.
Implement Neutral Background Colors to Highlight Key Features
Choose muted background tones that support rather than compete with your primary data elements. Use light grays (#f5f5f5) or off-whites (#fafafa) for base maps, allowing colorful satellite features to maintain visual prominence. Apply darker neutrals (#424242) for night-time imagery or urban heat island mapping where bright data points need maximum contrast. Avoid pure white or black backgrounds that create harsh visual boundaries and reduce overall map legibility in both digital and print formats.
Optimize Scale and Resolution for Maximum Impact
Scale and resolution decisions determine whether your satellite imagery communicates effectively or overwhelms viewers with unnecessary detail. Strategic optimization transforms raw data into compelling visual stories.
Select Appropriate Zoom Levels for Your Narrative Purpose
Choose zoom levels that support your specific story objectives. Regional environmental monitoring requires 1:50,000 to 1:100,000 scales to show broad patterns across watersheds or forest ecosystems. Urban planning presentations work best at 1:10,000 to 1:25,000 scales where individual buildings and infrastructure remain visible. Disaster response mapping demands 1:5,000 or closer scales to identify damaged structures and access routes. Match your zoom level to the decision-making needs of your audience rather than defaulting to maximum available resolution.
Balance Detail Density with Overall Comprehension
Manage information density to prevent cognitive overload in your presentations. High-resolution satellite imagery contains millions of pixels that can distract from key messages if not carefully filtered. Apply appropriate smoothing algorithms to 30-meter Landsat data when displaying regional trends spanning multiple counties. Reduce detail density in background areas using gaussian blur or generalization techniques while maintaining sharp focus on areas of interest. Your viewers should grasp the main story within three seconds of viewing the map.
Ensure Consistent Resolution Across Multiple Map Elements
Maintain uniform pixel density across all map components for professional presentation quality. Mixed resolution elements create jarring visual transitions that undermine credibility. Resample all satellite imagery to match your base layer resolution using bilinear interpolation for continuous data or nearest neighbor for categorical land cover data. Vector overlays should align precisely with your imagery pixel grid to avoid antialiasing artifacts. Export final maps at 300 DPI for print materials or optimize web versions to match standard screen resolutions of 72-96 DPI.
Integrate Meaningful Typography and Labeling Systems
Typography transforms satellite imagery from raw data into comprehensible visual narratives. Professional labeling systems guide viewers through complex geospatial information while preserving the aesthetic integrity of your satellite presentations.
Choose Fonts That Complement Satellite Imagery Aesthetics
Select clean, sans-serif typefaces like Arial or Helvetica for optimal readability against detailed satellite backgrounds. Avoid decorative fonts that compete with imagery complexity. Use font weights strategically—medium weight for primary labels and light weight for secondary annotations. Consider condensed font variants to maximize label density without overwhelming your visual composition. Test font legibility at various zoom levels to ensure consistent performance across different viewing scales.
Position Labels to Avoid Cluttering Critical Visual Information
Place labels in negative space or low-detail areas to preserve important visual data. Use leader lines sparingly to connect labels with distant features, maintaining clean sight lines. Implement label offset strategies that position text adjacent to rather than directly over key features. Establish consistent spacing rules—maintain minimum 10-pixel buffers around high-priority elements. Consider dynamic label placement algorithms in GIS software to automatically optimize positioning based on feature density.
Implement Hierarchical Text Sizing for Information Priority
Create clear information hierarchies using graduated font sizes—18pt for primary features, 14pt for secondary elements, and 10pt for tertiary details. Bold formatting distinguishes critical infrastructure or boundary labels from general annotations. Use consistent size ratios (typically 1.5x scaling) between hierarchy levels to maintain visual coherence. Apply color variations alongside size changes to reinforce importance levels. Reserve the largest text sizes for map titles and major geographic identifiers that anchor your entire presentation.
Apply Strategic Layering Techniques for Information Depth
Effective satellite image presentations require careful orchestration of multiple data layers to reveal complex spatial relationships. Strategic layering transforms overwhelming datasets into coherent visual narratives that guide viewers through your analytical findings.
Stack Data Overlays Without Overwhelming Base Imagery
Balance your overlay density by limiting active layers to three primary datasets per view. You’ll maintain visual clarity by organizing vector overlays, thematic data, and annotation layers in distinct visual groups. Keep base satellite imagery at 70-80% opacity when adding demographic overlays, transportation networks, or administrative boundaries. This approach preserves essential ground truth while highlighting analytical insights that support your mapping objectives.
Use Transparency Effects to Reveal Multiple Data Dimensions
Implement graduated transparency values ranging from 30-70% opacity to create depth perception across overlapping datasets. You can reveal underlying terrain features while displaying population density gradients, land use classifications, or environmental monitoring data. Apply transparency masks to weather overlays, pollution plumes, or flood extent polygons to show both current conditions and baseline satellite imagery simultaneously.
Create Visual Separation Through Selective Layer Opacity
Establish information hierarchy through strategic opacity adjustments that emphasize critical data layers while maintaining context. You’ll achieve optimal results by setting primary analysis layers at 85-100% opacity, secondary reference data at 50-65%, and background context layers at 25-40%. This selective approach prevents visual competition between datasets while ensuring viewers can distinguish between active analysis areas and supporting geographic context.
Incorporate Interactive Elements for Enhanced User Engagement
Interactive elements transform static satellite imagery into dynamic exploration tools that engage viewers and reveal deeper insights within your geospatial data.
Design Intuitive Zoom and Pan Navigation Controls
Position navigation controls in the upper-right corner of your map interface for consistent user experience. Use scroll wheel zoom functionality with discrete zoom levels that maintain satellite image quality at each scale. Design pan controls with momentum-based scrolling that feels natural and responsive. Implement zoom extent limits to prevent users from navigating beyond your data boundaries. Add keyboard shortcuts like arrow keys for precise panning and plus/minus keys for zoom control. Include a “fit to extent” button that returns users to the full map view instantly.
Add Clickable Hotspots for Detailed Information Access
Create clickable hotspots over key features in your satellite imagery using semi-transparent circular markers or subtle geometric shapes. Link each hotspot to popup windows containing detailed metadata, temporal comparisons, or measurement data. Position hotspots strategically to avoid visual clutter while ensuring discoverability. Use consistent icon styling across all interactive points to maintain visual coherence. Implement hover effects that preview information before clicking to improve user experience. Design popup content with clear hierarchy using headings, bullet points, and concise descriptions that complement the visual satellite data.
Implement Toggle Features for Comparative Analysis
Enable layer toggle controls that allow users to switch between different satellite image dates, data types, or analytical overlays. Create before-and-after comparison modes using split-screen views or opacity sliders for temporal analysis. Design toggle buttons with clear labeling and visual feedback to indicate active states. Implement swipe functionality for mobile users to compare different satellite captures seamlessly. Add batch toggle options that enable multiple related layers simultaneously. Include preset viewing modes like “Environmental Monitoring” or “Urban Development” that activate specific layer combinations for targeted analysis workflows.
Utilize Compelling Visual Storytelling Through Temporal Sequences
Temporal sequences transform static satellite imagery into powerful narratives that reveal Earth’s dynamic processes. You’ll create compelling visual stories by organizing imagery chronologically to document environmental changes, urban development, and natural phenomena across time.
Create Before-and-After Comparison Layouts
Position satellite images side-by-side with identical geographic extents and consistent color grading to highlight temporal changes effectively. You’ll achieve maximum impact by aligning imagery pixels precisely and maintaining uniform scale bars, north arrows, and coordinate systems across both timeframes. Select high-contrast dates that capture significant transformations like deforestation, urban expansion, or disaster impacts. Apply synchronized zoom levels and identical layer transparency settings to ensure viewers can directly compare features without visual distraction from inconsistent presentation elements.
Design Time-Lapse Presentations for Change Documentation
Compile sequential satellite images into animated sequences that reveal gradual environmental processes over months or years of observation. You’ll optimize frame rates between 2-5 seconds per image to allow adequate viewing time while maintaining narrative momentum through your temporal dataset. Standardize image preprocessing workflows including atmospheric correction, geometric alignment, and color normalization across your entire time series. Add temporal metadata overlays showing acquisition dates and seasonal indicators to provide context for observed changes in vegetation patterns, water levels, or urban development phases.
Structure Sequential Imagery for Narrative Flow
Organize your temporal satellite imagery following chronological progression with consistent visual elements that guide viewers through your story arc effectively. You’ll establish clear viewing patterns by maintaining identical map extents, legend positions, and annotation styles throughout your sequence presentation. Design transition elements like fade effects or progressive overlays that smoothly connect different time periods without jarring visual breaks. Include contextual reference points such as permanent geographic features or infrastructure that remain stable across your temporal range to anchor viewer orientation throughout the narrative progression.
Implement Consistent Branding and Professional Finishing Touches
Professional satellite map presentations require meticulous attention to branding consistency and finishing details that distinguish amateur work from publication-ready cartography.
Apply Uniform Color Schemes Across All Map Components
Maintain consistent color palettes throughout your satellite map presentation to establish visual cohesion. Use identical hex values for similar data categories across multiple map views, ensuring your legend colors match precisely with map symbols. Apply the same accent colors for interactive elements like buttons and hover states. Standardize your color temperature – if you’re using cool blues for water features, maintain that temperature across all blue elements rather than mixing warm and cool variants within the same presentation.
Enjoy refreshing water with the Avalon Bottom Loading Water Cooler. It offers hot, cold, and room temperature options, a BioGuard anti-microbial coating, and a child safety lock for peace of mind.

Add Professional Legends and Scale References
Position legends strategically in consistent locations across all map panels, typically in the lower-left or upper-right corners. Design your legend symbols to match exactly what appears on the map, using identical line weights and fill patterns. Include numerical scale bars with multiple unit measurements (miles and kilometers) positioned away from critical map features. Add north arrows only when map orientation isn’t obvious, using simple, professional designs that complement your overall aesthetic rather than ornate compass roses.
Include Attribution and Data Source Information
Document all data sources with complete attribution statements positioned consistently across your map series. List satellite imagery providers, acquisition dates, and processing algorithms in a dedicated metadata panel or footer area. Include your organization’s logo and contact information in a standard location on every map. Add copyright notices for proprietary datasets and ensure compliance with licensing requirements from imagery providers like Landsat, Sentinel, or commercial vendors. This transparency builds credibility and meets professional cartographic standards.
Conclusion
These seven creative map design principles provide you with a comprehensive framework for transforming raw satellite imagery into compelling visual narratives. By implementing strategic color choices thoughtful layering techniques and interactive elements you’ll create presentations that captivate your audience while delivering clear actionable insights.
Remember that effective satellite map design isn’t just about technical precision—it’s about storytelling. Your maps should guide viewers through complex geospatial data seamlessly revealing patterns and relationships that might otherwise remain hidden.
Start applying these principles to your next satellite imagery project and watch as your data transforms from overwhelming datasets into powerful communication tools that resonate with your audience and drive meaningful engagement.
Frequently Asked Questions
What makes satellite map design effective?
Effective satellite map design relies on clear visual hierarchy, strategic color contrast, and proper scale optimization. The key is transforming raw satellite data into engaging visual narratives that communicate insights clearly. Poor design can hinder the impact of valuable satellite imagery, while good design principles help viewers understand complex geospatial data quickly and accurately.
How do I choose the right colors for satellite maps?
Use high-contrast color palettes to enhance readability and apply graduated color schemes to reveal data relationships. Implement neutral background colors to make key features stand out. Maintain consistent hex values for similar data categories across all map components. Strategic color choices create visual hierarchy and prevent viewer confusion.
What’s the optimal scale and resolution for satellite imagery?
Select zoom levels based on your narrative objectives – broader scales work for regional monitoring while closer scales suit urban planning. Balance detail density to prevent cognitive overload using techniques like smoothing algorithms. Maintain consistent resolution across all map elements and properly align vector overlays to ensure professional quality presentation.
How should I handle typography and labels on satellite maps?
Use clean, sans-serif typefaces for optimal readability with strategic font weights and sizes to create information hierarchy. Position labels in negative space to avoid cluttering visual information. Reserve largest text sizes for map titles and major geographic identifiers. Implement consistent spacing rules throughout your design for professional appearance.
What are the best practices for layering satellite data?
Limit active layers to three primary datasets per view to maintain visual clarity. Keep base satellite imagery at 70-80% opacity when adding overlays. Use graduated transparency values to create depth perception and establish information hierarchy. Strategic opacity adjustments ensure critical data layers are emphasized while maintaining essential context.
How can I make satellite maps more interactive?
Design intuitive zoom and pan navigation controls in the upper-right corner with scroll wheel and keyboard shortcuts. Create clickable hotspots over key features linking to detailed metadata. Implement toggle features for comparative analysis between different satellite images or data types. Include clear labeling and visual feedback for enhanced user experience.
Why is temporal sequencing important in satellite imagery?
Temporal sequences document changes over time by organizing imagery chronologically. Create before-and-after comparison layouts with side-by-side images to highlight transformations effectively. Design time-lapse presentations with optimized frame rates and consistent preprocessing workflows. Structure sequential imagery with stable geographic reference points to maintain narrative flow.
What professional finishing touches should I include?
Maintain uniform color schemes across all map components for visual cohesion. Include properly positioned legends, scale references, and attribution information. Document all data sources and include necessary copyright notices to meet professional cartographic standards. Consistent branding elements establish credibility and enhance overall presentation quality.