
6 Methods for Testing Symbol Effectiveness That Improve Precision
You’ve designed what you think is the perfect symbol – but how do you know it actually works? Whether you’re creating icons for your app or developing brand logos your symbols need to communicate clearly and instantly with your target audience.
Testing symbol effectiveness isn’t just about personal preference – it’s about measurable performance that directly impacts user experience and business outcomes. The right testing methods reveal whether your symbols truly resonate with users or create confusion that drives them away.
From A/B testing to eye-tracking studies these six proven methods will help you validate your symbol choices with real data rather than guesswork.
Disclosure: As an Amazon Associate, this site earns from qualifying purchases. Thank you!
P.S. check out Udemy’s GIS, Mapping & Remote Sensing courses on sale here…
Test Symbol Recognition Speed and Accuracy
Recognition testing reveals how quickly and accurately users process your symbols in real-world scenarios.
Measure Time to Identify Symbols
Track millisecond-level response times using specialized software like PsychoPy or Tobii Pro Lab. Present symbols individually on screen and measure how long users take to identify their meaning. Record baseline speeds for common symbols (typically 200-500ms for familiar icons) and compare your designs against these benchmarks. Fast recognition speeds below 300ms indicate intuitive symbol design, while delays exceeding 1000ms suggest potential confusion that could impact user experience across digital interfaces.
Assess Correct Interpretation Rates
Calculate interpretation accuracy by dividing correct responses by total attempts across user groups. Test symbols with at least 30 participants to establish statistical significance, recording both initial impressions and secondary guesses. Effective symbols achieve 85% or higher accuracy rates in controlled testing environments. Document common misinterpretations to identify design elements causing confusion, such as ambiguous shapes or cultural context mismatches that reduce symbol clarity.
Compare Performance Across Demographics
Analyze recognition data by age groups, cultural backgrounds, and technical expertise levels to identify performance variations. Segment results into demographic categories like 18-35, 36-50, and 50+ age ranges, plus geographic regions when testing internationally. Significant performance gaps exceeding 20% between groups indicate symbols may not translate effectively across your target audience. Use this demographic data to refine symbol designs or create alternative versions for specific user segments.
Conduct User Experience Testing Sessions
User experience testing reveals how people actually interact with your symbols in real-world scenarios. You’ll gather behavioral data that complements quantitative metrics from recognition tests.
Observe Real-Time User Interactions
Watch users navigate interfaces containing your symbols without providing guidance or hints. Record their mouse movements, clicks, and pauses using screen recording software like Hotjar or FullStory. Notice when users hover over symbols repeatedly or click incorrect elements. Document instances where users immediately understand symbol meanings versus moments when they appear confused. Track completion times for tasks involving symbol recognition to identify friction points in your design.
Document Navigation Patterns and Hesitations
Map user pathways through your interface to identify where symbol confusion occurs most frequently. Note specific locations where users pause for more than three seconds before interacting with symbols. Record backtracking behaviors when users click symbols then immediately navigate away. Create heat maps showing where users’ attention lingers longest on symbol-heavy pages. Analyze scroll patterns to determine if users skip sections with unclear symbols. Document any instances where users abandon tasks after encountering confusing symbolic elements.
Gather Qualitative Feedback on Symbol Clarity
Conduct think-aloud sessions where users verbalize their thought processes while interacting with symbols. Ask participants to describe what they expect each symbol to represent before clicking. Record direct quotes about symbol meanings to identify common misinterpretations. Use follow-up interviews to understand why certain symbols felt intuitive while others caused confusion. Collect suggestions for alternative symbol designs from users who struggled with current options. Document cultural or demographic factors that influence symbol interpretation during testing sessions.
Analyze Symbol Performance Through A/B Testing
A/B testing provides quantifiable data on how different symbol designs perform with real users. You’ll create controlled experiments that compare symbol variations to determine which designs drive better user engagement and task completion.
Create Multiple Symbol Variations
Design 3-5 symbol variations that test specific elements like color, shape, or iconography style. Keep one element constant while changing others—for example, test different arrow styles for navigation while maintaining consistent sizing. Create variations that represent distinct design approaches rather than minor tweaks. Document each variation’s design rationale and ensure they’re technically identical in file size and loading speed to avoid performance bias.
Measure Conversion Rates and Click-Through Data
Track quantitative metrics including click-through rates, task completion percentages, and time-to-action for each symbol variant. Use analytics tools like Google Analytics or specialized A/B testing platforms to capture user interactions automatically. Set up conversion goals that align with your symbol’s intended purpose—whether that’s navigation clicks, form submissions, or purchase completions. Monitor statistical significance levels and aim for at least 95% confidence before drawing conclusions.
Identify Top-Performing Symbol Designs
Analyze your A/B test data to determine which symbol variations achieve the highest conversion rates and user engagement metrics. Look for patterns in demographic performance—certain symbols may work better for specific age groups or device types. Compare not just click rates but also subsequent user behavior like bounce rates and session duration. Select winning symbols based on statistical significance rather than marginal improvements, and consider testing winning variants against new challengers in ongoing optimization cycles.
Evaluate Symbol Effectiveness Using Eye-Tracking Technology
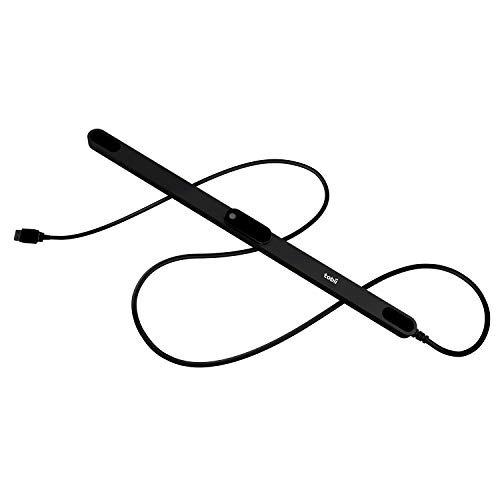
Immerse yourself in simulation gaming with the Tobii Eye Tracker 5. This device combines head and eye tracking for enhanced experiences in over 170 games, all without the need for wearables.
Eye-tracking technology provides precise data on how users visually process symbols, revealing unconscious viewing behaviors that surveys can’t capture.
Track Visual Attention Patterns
Eye-tracking software maps exactly where users look first when encountering your symbols. Heat maps show concentrated viewing areas, while gaze plots reveal the sequence of visual attention across your interface. You’ll discover whether users notice important symbols immediately or if competing elements distract their focus. This data helps identify which symbols draw attention naturally versus those that get overlooked. Advanced eye-tracking systems record millisecond-level timing data, showing how quickly users locate specific symbols during task completion.
Measure Fixation Duration on Symbols
Fixation time indicates how much cognitive effort users need to process each symbol. Short fixations under 200 milliseconds suggest instant recognition, while longer durations above 500 milliseconds indicate confusion or uncertainty. You can compare fixation times across different symbol designs to identify which versions require less mental processing. Eye-tracking equipment measures pupil dilation alongside fixation duration, providing additional insight into cognitive load. This quantitative data helps you optimize symbols for faster comprehension and reduced user fatigue.
Identify Areas of Visual Confusion
Eye-tracking reveals specific problem areas where users struggle with symbol interpretation. Erratic eye movement patterns, multiple return fixations, and extended scanning behaviors indicate visual confusion points. You’ll see exactly which symbol elements cause hesitation or misunderstanding through detailed gaze path analysis. The technology captures subtle behaviors like micro-saccades and regression patterns that signal processing difficulties. This precise feedback enables targeted design improvements to eliminate confusion sources and enhance symbol clarity.
Measure Symbol Comprehension Across Cultural Groups
Cultural variations in symbol interpretation can significantly impact the effectiveness of your designs across different markets and user groups.
Test International User Understanding
Recruit participants from your target international markets to evaluate symbol recognition rates across different regions. Set up remote testing sessions with users from at least 3-5 countries where your symbols will appear. Create standardized tasks that measure how quickly participants identify symbol meanings and track their accuracy rates. Document specific cultural contexts where certain symbols perform poorly or create confusion. Compare recognition speeds between domestic and international users to identify symbols that need localization or redesign for global audiences.
Assess Cultural Interpretation Differences
Analyze how different cultural groups interpret the same symbols by conducting comparative studies across demographic segments. Use surveys and interviews to uncover varying associations people make with specific visual elements like colors, shapes, and metaphors. Track instances where symbols carry different meanings or emotional responses across cultures. Create detailed reports showing which symbols maintain consistent interpretation and which ones require cultural adaptation. Document unexpected interpretations that could lead to misunderstandings or negative reactions in specific markets.
Validate Universal Symbol Applicability
Determine which symbols work effectively across all target cultures by testing comprehension rates with diverse international user groups. Establish baseline performance metrics for symbols that claim universal recognition, such as common interface icons or warning symbols. Compare recognition accuracy between culturally-specific and supposedly universal designs to identify truly cross-cultural symbols. Test symbol effectiveness in both high-context and low-context cultures to ensure broad applicability. Validate that universal symbols maintain their intended meaning without cultural adaptation or additional explanatory text.
Implement Post-Deployment Performance Analytics
Once you’ve deployed your chosen symbols, you’ll need ongoing measurement to ensure they’re performing as expected in real-world conditions.
Monitor User Engagement Metrics
Track click-through rates and interaction frequency to measure how effectively your symbols guide user behavior. Set up analytics dashboards that monitor hover rates, click patterns, and time spent on symbol-related tasks. Compare engagement levels between different symbol variations you’ve deployed. Document weekly performance trends to identify symbols that aren’t meeting engagement benchmarks. Use heat mapping tools to visualize which symbols attract the most user attention during normal website usage.
Track Error Rates and Help Requests
Measure support ticket volume and user confusion indicators to identify symbols causing ongoing problems. Monitor customer service inquiries related to navigation difficulties or misunderstood interface elements. Track form abandonment rates and task completion failures that correlate with specific symbols. Set up automated alerts when error rates exceed acceptable thresholds. Document common user complaints and questions that suggest symbol clarity issues requiring immediate attention.
Analyze Long-Term Symbol Adoption Patterns
Evaluate user behavior changes over extended periods to understand how symbol familiarity develops within your audience. Track performance metrics across 3-6 month intervals to identify symbols that improve with user exposure versus those that remain problematic. Monitor demographic shifts in symbol comprehension as your user base evolves. Compare new user performance against returning users to measure learning curves. Use cohort analysis to determine which symbols require ongoing education versus intuitive recognition.
Conclusion
Testing symbol effectiveness isn’t optional—it’s critical for successful user experience and business outcomes. You now have six proven methods to validate your symbol choices with real data rather than assumptions.
Remember that different testing approaches reveal unique insights. Eye-tracking shows unconscious behavior patterns while A/B testing provides quantifiable performance data. Cultural testing ensures global effectiveness and post-deployment analytics monitor long-term success.
Start implementing these methods systematically in your design process. You’ll discover which symbols truly resonate with your audience and identify areas for improvement before they impact your bottom line.
The investment in proper symbol testing pays dividends through improved user engagement reduced confusion and stronger brand recognition across all your target markets.
Frequently Asked Questions
Why is testing symbol effectiveness important for businesses?
Testing symbol effectiveness is crucial because symbols directly impact user experience and business outcomes. Rather than relying on personal preferences, measurable performance data helps ensure symbols communicate clearly with your target audience. Poor symbol choices can lead to user confusion, reduced engagement, and lower conversion rates, making data-driven testing essential for success.
What are the main methods for testing symbol recognition?
The six proven testing methods include A/B testing, eye-tracking studies, user experience testing sessions, recognition speed measurements, accuracy assessments, and cultural group analysis. These methods provide quantifiable data on how users interact with symbols, helping identify which designs perform best in real-world scenarios.
How do you measure symbol recognition speed?
Use specialized software to track the time it takes users to identify symbols. Fast recognition typically occurs within 2-3 seconds, while longer durations suggest confusion. Record response times across multiple users and calculate average recognition speeds to establish performance benchmarks for your symbols.
What is considered a good symbol accuracy rate?
A good symbol accuracy rate is typically 80% or higher, meaning at least 8 out of 10 users correctly interpret the symbol’s meaning. Calculate accuracy by dividing correct responses by total responses, then multiply by 100. Test with diverse demographic groups to ensure consistent performance across your target audience.
How does A/B testing help optimize symbol performance?
A/B testing compares different symbol variations by showing them to real users and measuring performance metrics like click-through rates and conversions. Create multiple designs focusing on specific elements like color or shape, then use analytics tools to track which version generates better engagement and achieves your intended goals.
What insights can eye-tracking provide for symbol testing?
Eye-tracking reveals unconscious viewing behaviors, showing where users look first and how long they focus on symbols. Short fixations indicate instant recognition, while longer durations suggest confusion. This technology maps visual attention patterns and identifies areas where users struggle with symbol interpretation, enabling targeted design improvements.
Why should symbols be tested across different cultural groups?
Cultural variations significantly impact symbol interpretation in different markets. The same symbol may have different meanings or cause confusion across cultures. Testing with international participants helps identify cultural contexts where symbols fail and validates which designs work universally without requiring cultural adaptation.
How do you monitor symbol performance after deployment?
Track user engagement metrics like click-through rates, interaction frequency, and task completion times using analytics tools. Monitor error rates and help requests to identify confusing symbols. Analyze long-term adoption patterns and use cohort analysis to understand how symbol familiarity develops over time among different user groups.