5 Best Map Design Techniques for Clarity
You’ve probably stared at a confusing map wondering why certain areas seem impossible to distinguish or why important information gets lost in visual chaos. The secret lies in color theory — a powerful design principle that transforms ordinary maps into clear communication tools that guide viewers effortlessly through complex geographical information.
Smart mapmakers use strategic color choices to highlight critical data reduce cognitive load and create intuitive visual hierarchies that make sense at first glance. When you understand how colors work together you’ll see why some maps instantly communicate their message while others leave viewers scratching their heads.
Disclosure: As an Amazon Associate, this site earns from qualifying purchases. Thank you!
Color Theory Creates Visual Hierarchy in Geographic Data
Strategic color application transforms complex geographic datasets into clear visual narratives that guide your viewers through information layers systematically.
P.S. check out Udemy’s GIS, Mapping & Remote Sensing courses on sale here…
Establishing Primary and Secondary Information Layers
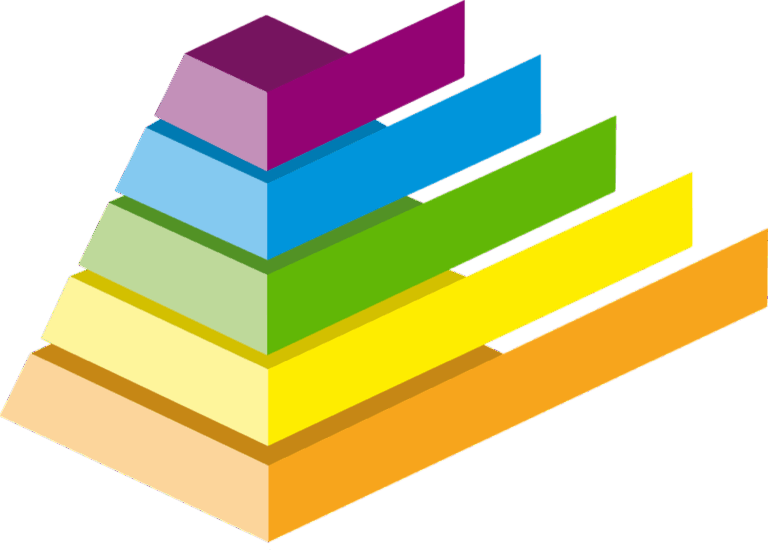
Designate your most critical data with high-contrast colors that immediately capture attention when viewers first encounter your map. Primary features like major highways or political boundaries require bold, saturated colors such as deep reds or vibrant blues that stand out against your base map. Secondary elements including minor roads, elevation contours, or demographic boundaries work best with muted tones, lighter saturations, or neutral grays that support rather than compete with your primary information layers.
Guiding Reader Attention Through Strategic Color Placement
Control visual flow by positioning warm colors at key decision points where you want readers to focus first, then using cooler tones to lead their eyes through supporting information. Bright oranges and reds naturally draw attention to critical locations like emergency facilities or high-priority zones, while blues and greens create visual pathways that connect related features across your map. This sequential color placement ensures readers process your geographic data in the logical order you’ve designed.
Color Theory Enhances Data Categorization and Classification
Effective data classification relies on your ability to create distinct visual categories that readers can immediately recognize and understand. Smart color choices transform overwhelming datasets into accessible information systems that support quick decision-making.
Using Hue Variations to Distinguish Map Elements
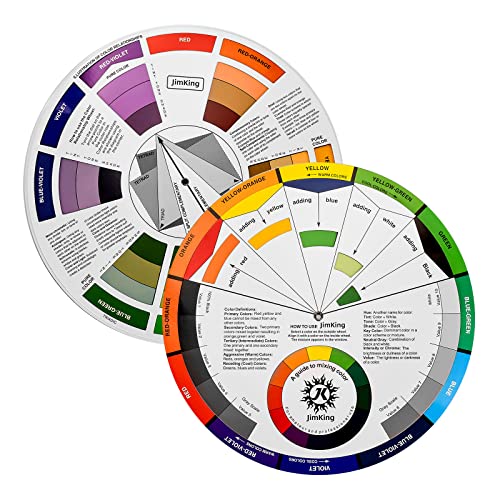
Distinct hue families separate categorical data more effectively than subtle color shifts. Choose colors from opposite sides of the color wheel—like blue and orange or red and green—to create maximum visual separation between different data categories. This approach works particularly well for qualitative data such as land use types, political boundaries, or demographic groups.
Easily organize and understand color relationships with this rotating color wheel. Ideal for artists and designers, it features a durable, UV-coated design for lasting use and clear color identification.
Assign consistent hue meanings across your entire map series. Reserve blue tones for water features, green hues for vegetation data, and warm colors for human-made infrastructure. This systematic approach helps viewers build visual literacy with your mapping conventions.
Enjoy refreshing water with the Avalon Bottom Loading Water Cooler. It offers hot, cold, and room temperature options, a BioGuard anti-microbial coating, and a child safety lock for peace of mind.

Implementing Saturation Levels for Data Intensity
Saturation adjustments communicate data intensity without changing fundamental color relationships. Use highly saturated colors for your most critical data points while applying muted versions of the same hues for secondary information. Population density maps benefit from this technique—bright red indicates high density areas while pale pink shows moderate concentrations.
Create graduated saturation scales that correspond directly to your quantitative data ranges. Start with your base hue at 100% saturation for maximum values, then reduce saturation by 20-25% increments for each data class. This maintains color family consistency while clearly distinguishing between intensity levels.
Color Theory Improves Accessibility and Universal Design
Color theory principles ensure your maps reach broader audiences by addressing visual limitations and following established accessibility standards.
Accommodating Color-Blind and Visually Impaired Users
Design maps that work for approximately 8% of men and 0.5% of women who experience color blindness. Use ColorBrewer 2.0’s colorblind-safe palettes to test your color schemes against deuteranopia, protanopia, and tritanopia conditions. Avoid red-green combinations for categorical data and supplement color coding with patterns, textures, or symbols. Implement high contrast ratios between foreground and background elements, ensuring your map elements remain distinguishable when viewed through colorblind simulation tools like Coblis or Stark browser extensions.
Following WCAG Guidelines for Map Readability
Maintain WCAG 2.1 AA standards with minimum 4.5:1 contrast ratios for normal text and 3:1 for large text elements. Test your map labels and symbols using WebAIM’s contrast checker to verify compliance across different background colors. Structure your color hierarchies to support screen readers by using semantic HTML elements and alternative text descriptions. Apply consistent color meanings throughout your map series and provide color legends that include both visual and textual descriptions of each category or data range.
Protect your eyes with RaoOG blue light blocking reading glasses. Featuring flexible spring hinges for a comfortable fit and accurate magnification for clear, distortion-free vision.

Color Theory Facilitates Intuitive Map Navigation
Color theory transforms complex navigation tasks into intuitive visual experiences by leveraging psychological color responses and cultural associations. Strategic color application guides users through spatial information with minimal cognitive effort.
Leveraging Cultural Color Associations
Red signals danger and stop conditions, making it ideal for marking restricted areas, hazards, or prohibited zones on navigation maps. Blue represents water bodies and safe passage routes, creating immediate recognition for maritime and hiking applications. Green indicates go-ahead zones, parks, and safe areas, while yellow conveys caution for construction zones or weather warnings. These universal associations reduce interpretation time and eliminate confusion across diverse user groups.
Creating Logical Color Progressions for Route Planning
Sequential color scales from light to dark intensities communicate route difficulty, elevation changes, or travel time effectively. Cool-to-warm progressions guide users from starting points (blues) to destinations (reds), creating natural directional flow. Complementary color pairs distinguish between primary and alternate routes, with high-contrast combinations like blue-orange ensuring clear visual separation. This systematic approach enables rapid route comparison and decision-making during time-sensitive navigation scenarios.
Color Theory Strengthens Emotional Connection and Engagement
Color choices trigger immediate psychological responses that determine how users connect with your maps. Strategic color application transforms data visualization from mere information display into compelling visual experiences that motivate action.
Evoking Appropriate Responses Through Color Psychology
Color psychology directly influences how viewers interpret and respond to geographic information. Red immediately signals urgency for emergency evacuation routes, while green creates comfort when marking safe zones or parks. Blue naturally represents water bodies and instills trust in navigation systems. Warm colors like orange and yellow draw attention to critical decision points, while cool purples and blues encourage methodical data analysis. Understanding these psychological triggers lets you guide viewer emotions and decision-making processes effectively.
Navigate with ease using this 7-inch GPS navigator, featuring real-time voice guidance and pre-loaded 2025 maps. Customize routes based on your vehicle type to avoid restrictions and receive speed & red light warnings.

Building Brand Recognition in Cartographic Design
Consistent color schemes across map series establish visual brand identity that users recognize instantly. Professional mapping organizations use signature color palettes that become synonymous with their data quality and expertise. USGS topographic maps employ distinctive green-brown-blue combinations that cartographers worldwide recognize. Transit authorities maintain consistent line colors across multiple map types, helping commuters navigate confidently. Your color choices should reinforce organizational credibility while supporting user familiarity and trust in complex geographic datasets.
Plan your next adventure with the 2025 National Geographic Road Atlas, covering the United States, Canada, and Mexico. Its durable, folded format (11 x 15 in) makes it ideal for hiking and camping trips.

Conclusion
Color theory transforms your maps from simple data displays into powerful communication tools. When you apply these five strategic approaches you’ll create visualizations that speak directly to your audience’s needs and cognitive patterns.
Your investment in color theory principles pays dividends through improved user engagement and data comprehension. Maps that leverage proper color relationships guide viewers effortlessly through complex information while maintaining accessibility standards.
The difference between amateur and professional cartography often lies in color execution. You now possess the knowledge to elevate your mapping projects and create visualizations that truly serve their intended purpose.
Frequently Asked Questions
What is color theory in map design?
Color theory in map design refers to the strategic use of colors to enhance clarity and communication in maps. It involves understanding how different colors interact and affect viewer perception to create intuitive visual hierarchies, reduce cognitive overload, and emphasize key information. Skilled mapmakers apply color theory principles to transform complex geographic data into clear, understandable visual narratives.
How does color help establish visual hierarchy in maps?
Color establishes visual hierarchy by using high-contrast colors for critical data and muted tones for supporting elements. Warm colors naturally draw attention to key areas, while cooler tones guide viewers through related information. This strategic color placement controls visual flow and ensures readers process geographic data in a logical sequence, making maps more effective and easier to understand.
What role does color play in data categorization on maps?
Color theory enhances data categorization by creating distinct visual categories for quick recognition. Different hues from opposite sides of the color wheel effectively separate categorical data like land use or demographic groups. Consistent color meanings across map series build visual literacy, while saturation levels communicate data intensity – highly saturated colors for critical points and muted versions for secondary information.
How can maps be made more accessible through color choices?
Maps become more accessible by using colorblind-safe palettes and avoiding problematic color combinations. Designers should follow WCAG 2.1 AA contrast ratio standards and test elements for compliance. Color hierarchies should support screen readers, and legends must include both visual and textual descriptions. This approach ensures maps are effective for color-blind and visually impaired users.
How does color psychology affect map navigation?
Color psychology leverages natural associations to facilitate intuitive navigation. Red signals danger, blue represents water, green indicates safety, and yellow conveys caution. These psychological responses reduce interpretation time and confusion. Sequential color scales from light to dark communicate route difficulty, while cool-to-warm progressions guide users from starting points to destinations, enabling rapid decision-making during navigation.
Can color choices create emotional engagement with maps?
Yes, strategic color choices transform data visualization into compelling experiences that motivate action. Color psychology influences viewer interpretation, with specific colors signaling urgency, comfort, trust, and attention. Consistent color schemes also build brand recognition in cartographic design, helping professional mapping organizations establish credibility and user familiarity while creating emotional connections with their audience.