5 Projection Transformation Techniques for 3D Mapping That Unlock Spatial Data
You’re working with 3D mapping data but struggling to display it accurately on flat surfaces. Projection transformation techniques bridge this gap by converting three-dimensional coordinates into two-dimensional representations without losing critical spatial information.
These mathematical methods determine how your 3D models appear on screens monitors and printed maps. The right projection technique can make the difference between a confusing visualization and one that clearly communicates your spatial data’s story.
Experience smooth, tear-free gaming and video with the Acer KB272 G0bi 27" Full HD monitor, featuring Adaptive-Sync (FreeSync Compatible) and a rapid 1ms response time. Enjoy vibrant colors with 99% sRGB coverage and versatile connectivity through HDMI and VGA ports.

Disclosure: As an Amazon Associate, this site earns from qualifying purchases. Thank you!
Perspective Projection: Creating Realistic Depth and Distance
Perspective projection transforms 3D coordinates into realistic 2D representations by mimicking how your eyes naturally perceive depth and distance. This technique creates the visual illusion that objects farther away appear smaller while maintaining accurate spatial relationships.
P.S. check out Udemy’s GIS, Mapping & Remote Sensing courses on sale here…
Understanding the Perspective Transformation Matrix
The perspective transformation matrix converts 3D world coordinates into normalized device coordinates through a 4×4 mathematical operation. You’ll work with four key parameters: field of view angle, aspect ratio, near clipping distance, and far clipping distance. These values determine how your 3D mapping data projects onto the 2D display surface. The matrix calculation applies perspective division to create the depth illusion, where objects at greater Z-distances appear proportionally smaller on your final rendered map.
Implementing Field of View and Aspect Ratio Controls
Field of view controls determine the angular extent of your visible mapping area, typically measured in degrees between 30-90 degrees. Wider angles capture more geographic area but introduce distortion at the edges, while narrower angles provide focused detail with minimal distortion. Your aspect ratio must match your display dimensions to prevent stretching or compression of mapped features. Calculate aspect ratio by dividing screen width by screen height, then adjust your projection matrix accordingly to maintain accurate proportional relationships between map elements.
Managing Near and Far Clipping Planes
Near and far clipping planes define the visible depth range in your 3D mapping projection, eliminating objects outside these boundaries. Set your near plane close enough to capture foreground details but far enough to prevent rendering artifacts and Z-fighting issues. Position the far plane to encompass your entire mapping dataset while avoiding excessive precision loss in depth calculations. The ratio between far and near planes affects depth buffer accuracy, so you’ll need to balance comprehensive coverage with rendering precision for optimal 3D mapping results.
Orthographic Projection: Maintaining True Proportions
Orthographic projection eliminates perspective distortion by maintaining parallel projection lines, making it essential for technical mapping applications where accurate measurements matter. This projection technique preserves the true proportions and dimensions of your 3D mapping data across the entire viewing plane.
Setting Up Parallel Projection Parameters
You’ll configure orthographic projection using six boundary parameters: left, right, bottom, top, near, and far clipping planes. These parameters define a rectangular viewing volume where parallel projection rays maintain consistent angles throughout the transformation process. The orthographic matrix calculation uses these boundaries to create uniform scaling across your entire 3D mapping dataset, ensuring measurement accuracy.
Configuring Orthographic Viewing Volume
Your viewing volume configuration determines the visible extent of your 3D mapping data within the orthographic projection space. You’ll set the width and height boundaries based on your mapping area’s dimensions, while near and far planes control the depth range. Proper volume configuration prevents data clipping and maintains consistent scale ratios across different elevation levels in your mapping project.
Applications in Technical and Architectural Visualization
Orthographic projection excels in architectural floor plans, engineering drawings, and topographic mapping where precise measurements are crucial. You’ll find it particularly valuable for cadastral mapping, utility infrastructure documentation, and construction site planning where dimensional accuracy outweighs realistic depth perception. Technical visualization workflows often combine orthographic views with measured grid overlays for enhanced spatial reference and measurement verification.
Plan your next adventure with the 2025 National Geographic Road Atlas, covering the United States, Canada, and Mexico. Its durable, folded format (11 x 15 in) makes it ideal for hiking and camping trips.

Stereographic Projection: Mapping Spherical Surfaces to Planes
Stereographic projection transforms spherical surfaces onto flat planes through a unique point-projection method. You’ll project each point on the sphere from a projection center to create conformal mappings that preserve local angles and shapes.
Mathematical Foundation of Stereographic Transformation
Achieve a flawless, even complexion with e.l.f. Flawless Satin Foundation. This lightweight, vegan formula provides medium coverage and a semi-matte finish for all-day wear, while hydrating your skin with glycerin.

You’ll use the stereographic projection formula to map points from a unit sphere to a plane. The transformation projects each point (x, y, z) on the sphere through the projection center (typically the north pole) onto the equatorial plane. The mathematical relationship is: X = x/(1-z) and Y = y/(1-z) for standard position. This preserves angles locally while transforming circles on the sphere into circles or lines on the plane, making it invaluable for conformal mapping applications.
Handling Poles and Infinite Points
You’ll encounter a singularity at the projection center where the mapping becomes undefined. The point opposite to the projection center maps to infinity on the plane, requiring special handling in digital implementations. You can manage this by using multiple projection centers or switching to inverse stereographic projection for polar regions. Numerical stability improves when you implement bounds checking and use alternative projection methods near the poles to prevent computational overflow.
Use Cases in Geographic and Astronomical Mapping
You’ll find stereographic projection essential for polar region mapping where other projections introduce significant distortion. It’s widely used in crystallography for plotting crystal faces and in complex analysis for conformal transformations. Astronomical applications include star charts and celestial navigation tools, where the angle-preserving property maintains constellation shapes. Meteorologists use it for polar weather mapping, while geologists apply it for structural geology projections and equal-area nets.
Cylindrical Projection: Wrapping 3D Content Around Curved Surfaces
Cylindrical projection transforms 3D mapping data by wrapping it around an imaginary cylinder, then unrolling it to create a flat representation. This technique excels at displaying continuous horizontal data while managing vertical distortion through mathematical adjustment.
Configuring Cylindrical Coordinate Systems
Configure your cylindrical coordinate system by defining the central meridian, standard parallels, and scale factor for your specific mapping region. Set the cylinder’s orientation to minimize distortion in your area of interest—typically aligning with the primary data extent. Adjust the radius parameter to control horizontal stretching, with smaller radii reducing distortion but limiting coverage area. Calibrate these parameters using control points from your 3D dataset to ensure accurate coordinate transformation and maintain spatial relationships across the mapped surface.
Texture Mapping and UV Coordinate Management
Map your 3D textures using UV coordinates that correspond to the cylindrical surface, wrapping the U-axis around the cylinder’s circumference while the V-axis represents height. Calculate UV coordinates using the formula U = longitude/360° and V = (latitude + 90°)/180° for geographic data, ensuring seamless texture wrapping at the cylinder’s edges. Handle texture seams by implementing proper edge blending and ensuring your texture resolution matches the projection’s angular precision requirements for optimal visual continuity.
Optimizing for Panoramic and VR Applications
Optimize cylindrical projections for panoramic displays by matching the projection’s aspect ratio to your target viewing device, typically using 2:1 ratios for 360-degree panoramas. Configure field-of-view parameters to accommodate VR headset specifications, adjusting the vertical angle range to prevent viewer discomfort and maintaining consistent pixel density across the viewing sphere. Implement adaptive resolution scaling that increases detail in the central viewing area while reducing processing overhead in peripheral regions, ensuring smooth performance during real-time navigation through your 3D mapped environment.
Experience immersive mixed reality, blending digital content with your real world. Enjoy enhanced graphics and wireless freedom for gaming, entertainment, and productivity, plus a 3-month trial of Meta Horizon+.

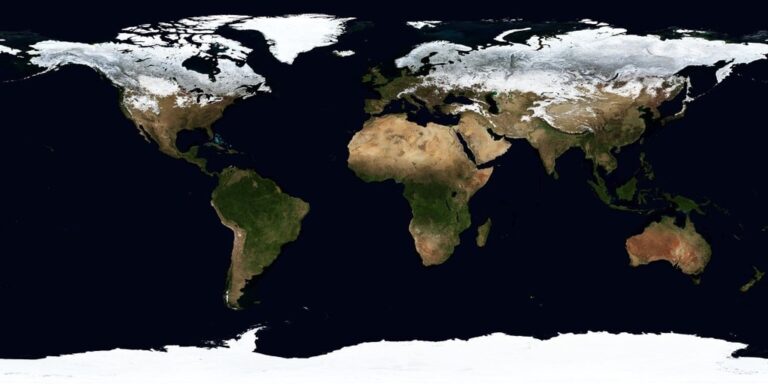
Mercator Projection: Transforming Global Data for Navigation
Mercator projection remains the cornerstone of global navigation systems due to its unique ability to preserve angles and directions across curved Earth surfaces. You’ll find this conformal projection essential for maritime navigation and web mapping applications where directional accuracy takes precedence over area preservation.
Navigate with ease using this 7-inch GPS navigator, featuring real-time voice guidance and pre-loaded 2025 maps. Customize routes based on your vehicle type to avoid restrictions and receive speed & red light warnings.

Implementing Mercator Transformation Algorithms
Configure your Mercator transformation using the standard formula: y = ln(tan(π/4 + φ/2)), where φ represents latitude in radians. You’ll need to establish the central meridian and false easting parameters to position your mapping dataset correctly. Apply scale factors between 0.9996 and 1.0004 to minimize distortion in your area of interest. Implement inverse transformation calculations for converting projected coordinates back to geographic coordinates during interactive navigation applications.
Handling Distortion at Polar Regions
Limit your Mercator projections to latitudes between 85°N and 85°S to prevent extreme distortion near polar regions. You’ll encounter infinite scaling at the poles due to the projection’s mathematical properties. Switch to Web Mercator (EPSG:3857) for digital mapping applications, which clips at approximately 85.05° latitude. Consider alternative projections like Universal Polar Stereographic for polar research data. Implement adaptive scaling functions that gradually transition to different projection methods as you approach extreme latitudes.
Integration with Geographic Information Systems
Connect Mercator-projected data to GIS platforms using EPSG coordinate reference system codes, particularly EPSG:4326 for WGS84 geographic coordinates and EPSG:3857 for Web Mercator. You’ll need to configure proper datum transformations when combining datasets from different coordinate systems. Utilize GIS reprojection tools like GDAL or ArcGIS Spatial Analyst to convert between projection systems while maintaining spatial accuracy. Validate your transformations using ground control points and compare projected distances against known measurements to ensure navigation reliability.
Conclusion
Mastering these five projection transformation techniques empowers you to handle any 3D mapping challenge with confidence. Each method serves distinct purposes—from perspective projection’s realistic depth perception to Mercator’s navigation precision.
Your choice of projection technique directly impacts data visualization quality and user experience. Understanding when to apply orthographic projection for technical accuracy versus stereographic for polar mapping ensures optimal results.
Remember that successful 3D mapping isn’t just about the mathematics—it’s about selecting the right tool for your specific application. Whether you’re developing VR environments or creating GIS applications these techniques provide the foundation for professional-grade spatial visualization that meets both technical requirements and user expectations.
Frequently Asked Questions
What are projection transformation techniques in 3D mapping?
Projection transformation techniques are mathematical methods that convert three-dimensional coordinates into two-dimensional representations while preserving essential spatial information. These techniques solve the challenge of accurately displaying 3D mapping data on flat surfaces like computer screens or paper maps.
What is perspective projection and when should it be used?
Perspective projection creates realistic depth and distance in 2D representations by mimicking human perception, making distant objects appear smaller while maintaining spatial relationships. It’s ideal for visualization applications where realistic appearance is more important than precise measurements.
How does the perspective transformation matrix work?
The perspective transformation matrix is a 4×4 mathematical operation that converts 3D coordinates into normalized device coordinates. It uses key parameters including field of view angle, aspect ratio, and near and far clipping distances to determine how 3D data projects onto a 2D surface.
What is orthographic projection and what are its advantages?
Orthographic projection eliminates perspective distortion by maintaining parallel projection lines, preserving true proportions and dimensions. It’s essential for technical mapping applications like architectural floor plans, engineering drawings, and topographic mapping where accurate measurements are crucial.
When should I use stereographic projection?
Stereographic projection is ideal for transforming spherical surfaces onto flat planes while preserving local angles and shapes. It’s particularly valuable for geographic and astronomical mapping, polar regions, crystallography, meteorology, and celestial navigation tools where maintaining constellation shapes is important.
What is cylindrical projection best suited for?
Cylindrical projection works by wrapping 3D mapping data around an imaginary cylinder and unrolling it for flat representation. It’s particularly effective for displaying continuous horizontal data and is commonly used in panoramic applications, virtual reality environments, and global mapping systems.
Why is Mercator projection important for navigation?
Mercator projection preserves angles and directions on curved Earth surfaces, making it invaluable for global navigation systems. It maintains straight-line compass bearings as straight lines on the map, which is essential for marine and aviation navigation, though it causes distortion at polar regions.
How do I choose the right projection technique for my 3D mapping project?
The choice depends on your specific needs: use perspective projection for realistic visualization, orthographic for precise measurements, stereographic for spherical data preservation, cylindrical for panoramic views, and Mercator for navigation applications. Consider factors like accuracy requirements, distortion tolerance, and intended use case.