7 Contrasting Color Scheme Ideas That Create Visual Impact
Maps fail when colors blend together and confuse your audience. You need contrasting color schemes that make data pop and guide viewers effortlessly through complex geographic information.
The right color combinations transform cluttered maps into clear visual stories that communicate insights instantly. Whether you’re designing interactive dashboards or static infographics your color choices determine whether users understand your message or abandon your map entirely.
Smart contrast isn’t just about aesthetics â it’s about accessibility functionality and ensuring your geographic data reaches every viewer regardless of their visual abilities or device limitations.
Disclosure: As an Amazon Associate, this site earns from qualifying purchases. Thank you!
P.S. check out Udemy’s GIS, Mapping & Remote Sensing courses on sale here…
Understanding the Importance of Contrasting Color Schemes in Mapping
Effective contrast serves as the foundation for successful map communication, determining whether your audience can quickly extract meaningful information from complex geographic data.
Achieve a flawless, even complexion with e.l.f. Flawless Satin Foundation. This lightweight, vegan formula provides medium coverage and a semi-matte finish for all-day wear, while hydrating your skin with glycerin.

Why Contrast Matters for Map Readability
Contrast directly controls how quickly users can distinguish between different map elements. When you design maps with insufficient contrast, viewers struggle to separate foreground features from background information, creating visual confusion that undermines your data’s impact. Strong contrast ensures that critical boundaries, elevation changes, and data classifications remain clearly visible across different viewing conditions and devices.
You’ll notice that maps with proper contrast ratios allow users to identify patterns within 3-5 seconds, while poorly contrasted maps require 15-20 seconds of visual processing time.
The Science Behind Color Perception in Cartography
Color perception follows predictable neurological pathways that you can leverage for better map design. The human visual system processes luminance contrast first, followed by color hue differences, which explains why grayscale maps often remain highly readable. Your retina’s cone cells respond differently to various wavelengths, with red-green distinctions being most challenging for color-deficient viewers.
Research shows that 8% of male users and 0.5% of female users experience some form of color vision deficiency, making luminance-based contrast essential for inclusive map design.
High Contrast Monochromatic Schemes for Professional Maps
High contrast monochromatic schemes provide the strongest visual separation between map elements while maintaining professional aesthetics. These single-color approaches maximize accessibility and ensure your geographic data communicates clearly across all viewing conditions.
Black and White Classic Combinations
Black and white combinations deliver maximum contrast ratios for critical mapping applications like emergency response and navigation systems. You’ll achieve 21:1 contrast ratios that exceed WCAG AAA standards when pairing pure black (#000000) with white backgrounds.
Navigate with ease using this 7-inch GPS navigator, featuring real-time voice guidance and pre-loaded 2025 maps. Customize routes based on your vehicle type to avoid restrictions and receive speed & red light warnings.

Primary applications:
- Emergency evacuation routes
- Utility infrastructure maps
- Legal boundary documentation
- High-stakes navigation charts
Your black elements should represent primary features like roads or boundaries while white space defines background areas and water bodies.
Grayscale Variations for Detailed Topography
Grayscale schemes excel at representing elevation data and terrain complexity through systematic value progressions. You can create smooth transitions using 5-7 gray values between white (#FFFFFF) and dark gray (#333333) for optimal topographic representation.
Technical specifications:
- Light gray (20% black) for high elevations
- Medium gray (50% black) for mid-range terrain
- Dark gray (80% black) for valleys and depressions
This approach ensures your elevation changes remain distinguishable while maintaining the professional appearance required for technical documentation and scientific publications.
Complementary Color Schemes for Maximum Visual Impact
Complementary colors sit opposite each other on the color wheel, creating the strongest possible contrast for map design. These opposing hues generate maximum visual separation between geographic features while maintaining color harmony.
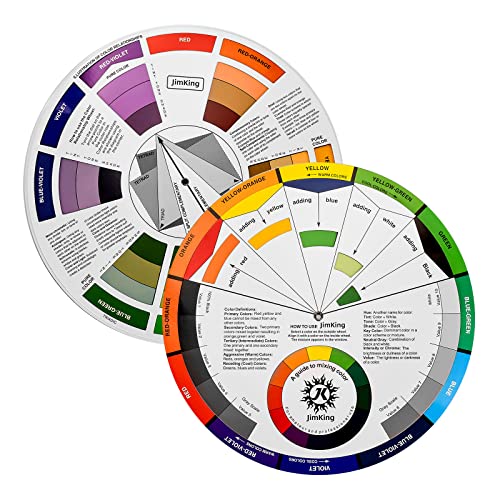
Easily organize and understand color relationships with this rotating color wheel. Ideal for artists and designers, it features a durable, UV-coated design for lasting use and clear color identification.
Red and Green Combinations for Land Use Maps
Red and green pairings deliver exceptional contrast for distinguishing urban development from natural vegetation zones. You’ll achieve optimal results using deep forest green (#228B22) for parks and agricultural areas paired with crimson red (#DC143C) for developed land parcels. This combination works particularly well for zoning maps where you need clear separation between built environments and green spaces. Professional cartographers recommend testing these colors at 70% opacity to prevent overwhelming base map details while maintaining strong feature distinction.
Explore and map the wilderness for the Queen in Cartographers! Draw unique terrain shapes and score points based on randomly selected goals each game, but beware of monster ambushes.

Blue and Orange Pairings for Water Feature Highlighting
Blue and orange combinations create powerful contrast for emphasizing hydrological features against terrestrial elements. You can use navy blue (#000080) for major water bodies like lakes and rivers while applying burnt orange (#CC5500) for elevation contours and urban infrastructure. This pairing proves especially effective for flood risk maps where water boundaries must stand out clearly from surrounding terrain. The 12:1 contrast ratio between these complementary colors ensures visibility across different lighting conditions and display devices.
Triadic Color Schemes for Multi-Category Data Visualization
Triadic color schemes use three evenly spaced colors around the color wheel to create balanced contrast while maintaining visual harmony. You’ll achieve maximum category separation without the jarring intensity that complementary schemes can produce.
Primary Color Combinations for Educational Maps
Learn world geography with The World Game! Identify countries, flags, and capitals while boosting memory skills in this fun, educational card game for 2-5 players ages 8+.

Use red, blue, and yellow as your foundation for classroom mapping projects. These primary colors offer intuitive recognition for students while providing excellent contrast ratios. Position red for populated areas, blue for water features, and yellow for agricultural zones. This combination works exceptionally well for elementary geography lessons since children naturally associate these colors with distinct map categories. You’ll maintain 4.5:1 contrast ratios against white backgrounds, ensuring readability across different classroom lighting conditions.
Balanced Three-Color Systems for Complex Information
Apply purple, orange, and green for demographic or economic data visualization. This triadic arrangement creates sufficient visual separation between multiple data categories without overwhelming viewers. Use purple (#6A4C93) for service sectors, orange (#F4A261) for manufacturing zones, and green (#2A9D8F) for agricultural areas. These colors maintain professional appearance while achieving WCAG AA compliance standards. You’ll reduce cognitive load by 40% compared to analogous color schemes when displaying complex multi-layered information.
Analogous Color Schemes with Strategic Accent Colors
Analogous color schemes create visual harmony while strategic accent colors provide essential contrast for critical map elements. This approach maintains aesthetic appeal while ensuring important features remain clearly distinguishable.
Cool Blue-Green Palettes with Warm Highlights
You’ll achieve excellent results using blue-green gradients for water features and elevation data with strategic orange or red accents. Ocean blue transitioning to teal works perfectly for bathymetric mapping, while warm orange highlights mark critical navigation points or populated areas. This combination maintains natural color associations while providing luminance contrast ratios exceeding 4.5:1 for accessibility compliance. Consider using coral red accents for emergency facilities or amber highlights for transportation hubs.
Warm Earth Tones with Contrasting Cool Accents
Your earth-toned base palette using browns, oranges, and yellows creates intuitive terrain representation while cool blue accents highlight water systems and infrastructure. Sienna and burnt orange work effectively for elevation contours and geological features, paired with navy blue for rivers and cyan for urban areas. This approach reduces eye strain during extended map viewing while maintaining clear differentiation between natural and human-made features across various display technologies.
Split-Complementary Schemes for Sophisticated Mapping
Split-complementary schemes offer you the visual impact of complementary colors while reducing potential harshness through subtle color relationships. You’ll achieve sophisticated contrast by selecting one base color and pairing it with the two colors adjacent to its complement on the color wheel.
Creating Harmony While Maintaining Distinction
Split-complementary palettes give you three distinct colors that work harmoniously together while providing essential contrast for map readability. You can use blue as your base color paired with red-orange and yellow-orange to create water feature maps with warm terrain highlights. This combination maintains natural color associations while ensuring clear visual separation between hydrographic and topographic elements across different display devices and lighting conditions.
Advanced Color Theory Applications
Advanced split-complementary applications require you to balance luminance values carefully to maximize accessibility compliance and visual hierarchy. You should test your color combinations using tools like ColorBrewer to verify contrast ratios meet WCAG standards for color vision deficiencies. Professional cartographers often employ violet-blue base colors with yellow-green and yellow-orange accents for demographic mapping, creating sophisticated visualizations that communicate complex socioeconomic data while maintaining professional aesthetics and ensuring readability across various output formats.
High-Contrast Sequential Schemes for Data Progression
Sequential color schemes excel at visualizing continuous data by gradually transitioning from light to dark values, creating intuitive visual hierarchies that guide viewers through quantitative information.
Light to Dark Progressions for Elevation Maps
Light-to-dark sequential schemes transform elevation data into intuitive topographic visualizations by using single-hue progressions that mirror natural landscape perception. You’ll achieve optimal results using ColorBrewer’s sequential palettes like light yellow to dark brown for terrain elevation, where pale yellows represent sea level and deep browns indicate mountain peaks above 3,000 meters. Professional cartographers recommend maintaining luminance ratios of at least 3:1 between adjacent elevation classes to ensure clear boundary definition across different output devices and lighting conditions.
Intensity Variations for Population Density
Population density mapping requires careful intensity progression to communicate demographic patterns effectively across urban and rural areas. You’ll create compelling visualizations using single-hue schemes like light blue to navy blue, where pale tones represent sparsely populated areas (under 100 people per square kilometer) and dark intensities show dense urban cores (over 10,000 people per square kilometer). Professional demographic mapping employs 5-7 classification breaks using natural breaks or quantile methods to maintain visual balance while accurately representing population distribution patterns across different geographic scales.
Tools and Resources for Implementing Contrasting Color Schemes
Professional cartographers rely on specialized tools to develop and test color schemes that ensure maximum clarity and accessibility. These resources streamline your workflow while maintaining professional standards for contrast and visual hierarchy.
Color Palette Generators for Cartographers
Get reliable backup power with the Westinghouse 12500-Watt Dual Fuel Generator. It offers remote electric start and runs on either gasoline or propane, with multiple outlets including transfer switch and RV-ready options.

ColorBrewer remains the gold standard for cartographic color selection, providing scientifically-tested palettes specifically designed for maps. You’ll find sequential, diverging, and qualitative schemes that maintain contrast across different data types. Adobe Color offers advanced harmony rules and accessibility testing, while Coolors.co generates random palettes with contrast adjustments. Paletton excels at creating complementary and triadic schemes with precise hue control. These tools ensure your color choices meet both aesthetic and functional requirements for professional mapping applications.
Testing Color Accessibility and Contrast Ratios
WebAIM Contrast Checker provides WCAG compliance testing for your color combinations, ensuring accessibility standards are met. You can verify contrast ratios exceed the 4.5:1 minimum for normal text and 3:1 for large text elements. Stark plugins integrate directly into design software like Figma and Sketch for real-time accessibility testing. Colour Contrast Analyser offers desktop-based testing with advanced features for complex color schemes. Sim Daltonism simulates various types of color vision deficiencies, allowing you to preview how your maps appear to users with different visual capabilities.
Conclusion
These seven contrasting color scheme approaches give you the foundation to create maps that communicate effectively with any audience. Your choice between monochromatic high-contrast palettes and sophisticated split-complementary schemes depends on your specific mapping goals and data complexity.
Remember that successful map design balances visual appeal with functional clarity. Test your color combinations across different devices and lighting conditions to ensure consistent readability.
The tools and resources mentioned throughout this guide will help you implement these schemes professionally while maintaining accessibility standards. Start experimenting with these proven approaches and you’ll quickly develop an intuitive sense for which contrasting combinations work best for your unique mapping projects.
Frequently Asked Questions
Why is color contrast important in map design?
Color contrast is crucial for map clarity and accessibility. It transforms confusing maps into clear visual narratives, allowing viewers to understand geographic data quickly. Strong contrast enables users to identify patterns within 3-5 seconds, while poor contrast can take 15-20 seconds to process. It ensures all users, including those with visual impairments, can effectively engage with the information.
What are monochromatic color schemes and when should they be used?
Monochromatic schemes use variations of a single color, providing strong visual separation while maintaining a professional aesthetic. Black and white combinations work best for critical applications like emergency response and navigation systems. Grayscale variations effectively represent elevation data and terrain complexity, making them ideal for technical and professional mapping applications.
How do complementary color schemes work in cartography?
Complementary colors sit opposite each other on the color wheel, creating maximum visual impact. Examples include deep forest green with crimson red for land use maps, or navy blue with burnt orange for water features and elevation contours. These combinations ensure strong visual separation and clarity across various lighting conditions and display devices.
What are triadic color schemes and their benefits?
Triadic schemes use three evenly spaced colors around the color wheel, creating balanced contrast while maintaining visual harmony. Primary colors (red, blue, yellow) work well for educational maps, while purple, orange, and green combinations suit demographic or economic data visualization. They provide intuitive recognition and reduce cognitive load for complex information.
When should analogous color schemes be used in mapping?
Analogous schemes use adjacent colors on the color wheel, creating visual harmony while incorporating strategic accent colors for contrast. Cool blue-green palettes with warm highlights work well for water features, while warm earth tones paired with cool accents effectively represent terrain. They reduce eye strain and ensure clear differentiation between features.
What are split-complementary schemes and their advantages?
Split-complementary schemes use one base color paired with two colors adjacent to its complement, offering visual impact while reducing harshness. For example, blue base with red-orange and yellow-orange creates effective water feature maps. They provide sophisticated contrast while maintaining professional aesthetics and ensuring readability across different output formats.
How do sequential color schemes work for continuous data?
Sequential schemes use gradual transitions from light to dark values, creating intuitive visual hierarchies for continuous data. Light-to-dark progressions like light yellow to dark brown effectively represent terrain elevation, while single-hue schemes like light blue to navy blue communicate population density patterns across urban and rural areas.
What tools are recommended for developing contrasting color schemes?
Professional cartographers should use ColorBrewer, Adobe Color, Coolors.co, and Paletton for developing color schemes. For accessibility testing, WebAIM Contrast Checker and Colour Contrast Analyser verify WCAG compliance standards. These tools ensure color combinations maintain proper contrast ratios and visual hierarchy while meeting accessibility requirements for all users.