7 Best Elevation Data Representations
You’ve probably seen elevation data visualized through colorful topographic maps, but the world of elevation representation extends far beyond those familiar rainbow gradients. From cutting-edge 3D models to traditional contour lines, cartographers and data scientists employ seven distinct methods to transform raw elevation measurements into meaningful visual information. Understanding these diverse approaches can revolutionize how you interpret terrain data â whether you’re planning a hiking route, analyzing flood risks, or developing geographic applications.
Disclosure: As an Amazon Associate, this site earns from qualifying purchases. Thank you!
Contour Lines: The Traditional Foundation of Topographic Mapping
Achieve a flawless, even complexion with e.l.f. Flawless Satin Foundation. This lightweight, vegan formula provides medium coverage and a semi-matte finish for all-day wear, while hydrating your skin with glycerin.

Contour lines remain the fundamental method for representing elevation data on two-dimensional maps. These lines connect points of equal elevation, creating a visual representation of terrain that’s been trusted by cartographers and surveyors for over two centuries.
Explore and map the wilderness for the Queen in Cartographers! Draw unique terrain shapes and score points based on randomly selected goals each game, but beware of monster ambushes.

Understanding Contour Line Principles and Spacing
Contour lines follow specific mathematical rules that determine their accuracy and readability. Each line represents a fixed elevation interval, typically 10, 20, or 40 feet depending on your map scale and terrain complexity. Closer line spacing indicates steeper slopes, while wider spacing shows gentler gradients. You’ll find every fifth contour line drawn heavier (index contours) with elevation labels for quick reference. The contour interval you choose directly affects your map’s detail level and visual clarity.
P.S. check out Udemy’s GIS, Mapping & Remote Sensing courses on sale here…
Reading Elevation Changes Through Line Patterns
Line patterns reveal critical terrain features that help you interpret landscape characteristics. V-shaped contours pointing uphill indicate valleys or drainage channels, while V-shapes pointing downhill show ridges or spurs. Concentric circles represent hills or depressions, with hachure marks inside circles indicating depressions below surrounding terrain. You can determine slope steepness by measuring the horizontal distance between contours – closer lines mean steeper slopes requiring more caution during fieldwork or route planning.
Applications in Hiking Maps and Survey Work
Explore the world's most breathtaking landscapes with this guide to 100 unforgettable scenic trails. Discover essential information for planning your next hiking adventure.

Hiking maps rely heavily on contour lines for route planning and safety assessment. You’ll use contour spacing to identify difficult terrain, estimate hiking times, and locate water sources in valleys. Survey professionals depend on contours for site analysis, calculating cut-and-fill volumes, and determining drainage patterns. USGS topographic maps maintain 10-foot contour intervals for detailed work, while recreational hiking maps often use 40-foot intervals for improved readability across larger areas.
Digital Elevation Models (DEMs): High-Resolution Terrain Data
Digital Elevation Models revolutionize how you capture and analyze terrain data beyond traditional contour mapping. These grid-based datasets provide precise elevation values at regular intervals across landscapes.
Grid-Based Elevation Storage and Processing
Grid-based DEMs store elevation values in uniform cell matrices, typically at 1-meter to 30-meter resolutions depending on your mapping needs. You’ll find that raster cells contain single elevation values representing terrain height at specific coordinates. Processing algorithms interpolate between known elevation points to fill data gaps and smooth terrain surfaces. Modern DEM formats like GeoTIFF support massive datasets spanning entire watersheds or regions with compression ratios reaching 10:1.
LiDAR and Satellite Data Collection Methods
LiDAR sensors emit laser pulses to measure precise ground distances, creating elevation datasets accurate within 15 centimeters vertically. You can access airborne LiDAR data covering most urban areas through government portals like USGS Earth Explorer. Satellite missions including SRTM and ASTER provide global coverage at 30-meter resolution for regional mapping projects. Photogrammetry techniques extract elevation data from overlapping aerial photographs using stereo correlation algorithms that identify matching terrain features.
Measure distances accurately with the TF-Luna LiDAR module. This compact, low-power sensor uses TOF principles for stable ranging from 0.2 to 8 meters and offers UART/I2C communication.

GIS Integration and Analysis Capabilities
GIS software platforms like ArcGIS and QGIS process DEM data through specialized terrain analysis tools including slope calculation and watershed delineation. You’ll access viewshed analysis functions that determine visibility from specific observation points across complex topography. Hydrologic modeling capabilities extract stream networks and calculate flow accumulation patterns from DEM surfaces. Advanced interpolation methods including kriging and inverse distance weighting help you create seamless elevation surfaces from sparse survey points.
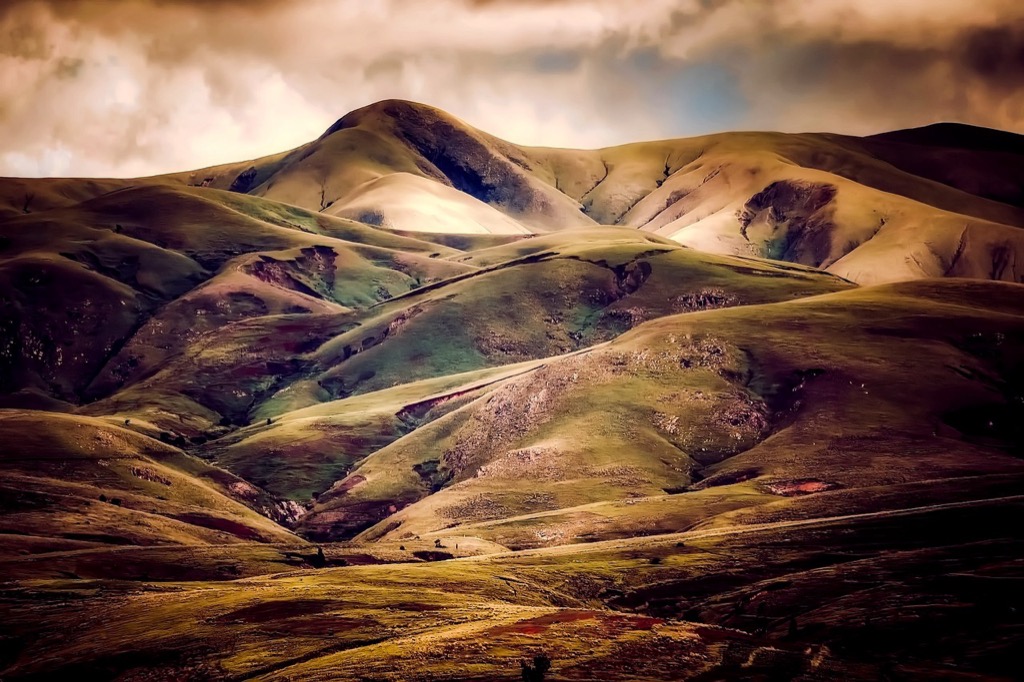
Shaded Relief Maps: Visual Depth Through Shadow Techniques
Explore the United States with this 3D raised relief map. Feel the terrain and understand topography through its tactile, vacuum-formed design.

Shaded relief maps transform flat terrain data into visually compelling three-dimensional representations by simulating shadows cast across the landscape. This technique creates an intuitive understanding of topography that surpasses traditional contour-only approaches.
Hillshading Algorithms and Light Source Positioning
Hillshading algorithms calculate shadow intensity based on surface angle relative to a virtual light source positioned northwest at 315 degrees with a 45-degree elevation angle. You’ll achieve optimal terrain definition by adjusting the azimuth between 300-330 degrees depending on your specific landscape orientation. Popular algorithms include the Horn method for smooth terrain and the Zevenbergen-Thorne approach for detailed surface analysis. Modern GIS software like ArcGIS Pro and QGIS provide these algorithms with customizable parameters for light direction and intensity.
Combining Relief with Other Cartographic Elements
Relief shading works most effectively when combined with hypsometric tinting, contour lines, and slope classification overlays. You can blend hillshade layers at 30-50% transparency over elevation color ramps to maintain depth perception while preserving elevation information. Cartographers often layer vegetation data, transportation networks, and political boundaries over relief maps using multiply or overlay blending modes. This multi-layer approach creates comprehensive visualizations that serve both analytical and presentation purposes while maintaining visual hierarchy through careful opacity management.
Enhanced Terrain Visualization for Navigation
Relief maps significantly improve navigation planning by revealing terrain complexity that contour lines alone cannot effectively communicate. You’ll find steep canyon walls, ridge systems, and valley networks immediately apparent through shadow patterns that guide route selection decisions. Mountaineering applications benefit from relief visualization combined with aspect analysis to identify sun exposure and weather protection zones. Digital platforms increasingly integrate real-time GPS positioning with relief base maps, allowing you to assess terrain difficulty and safety considerations during active navigation scenarios.
3D Terrain Models: Interactive Elevation Visualization
Three-dimensional terrain models represent the next evolution in elevation visualization, transforming static data into dynamic, explorable landscapes. These interactive models bridge the gap between traditional mapping and immersive spatial analysis.
Mesh Generation from Elevation Data Points
Triangulated Irregular Networks (TINs) form the foundation of most 3D terrain models by connecting elevation points through computational algorithms. Modern software like ArcGIS Pro and QGIS generates these triangular mesh structures using Delaunay triangulation methods that optimize surface accuracy. You’ll achieve the most realistic terrain representations by incorporating breaklines for ridges and valleys, which guide the triangulation process to preserve critical landscape features. Advanced mesh generation tools also apply smoothing algorithms to eliminate artifacts while maintaining elevation precision, particularly important when working with LiDAR datasets containing millions of points.
Real-Time Rendering and User Interaction
GPU-accelerated rendering engines enable smooth navigation through complex terrain models with frame rates exceeding 60 FPS on standard hardware. Professional applications like Cesium and ArcGIS Earth utilize Level-of-Detail (LOD) algorithms that dynamically adjust mesh resolution based on viewing distance and angle. You can implement interactive features including fly-through animations, cross-sectional profiling, and real-time slope analysis through WebGL-based platforms. Touch-enabled interfaces support intuitive gestures for rotation, zooming, and panning, while advanced systems integrate voice commands and gesture recognition for hands-free terrain exploration during field presentations.
Applications in Gaming and Virtual Reality
Game engines like Unity and Unreal Engine have revolutionized terrain visualization for both entertainment and professional applications. VR platforms such as Oculus and HTC Vive now support immersive terrain exploration using high-resolution elevation datasets from NASA and USGS sources. You’ll find these technologies particularly valuable for environmental impact assessments, where stakeholders can experience proposed developments within realistic landscape contexts. Military simulation systems utilize 3D terrain models for tactical training, while educational institutions employ VR terrain visualization to enhance geography and geology instruction through interactive field trip experiences.
Hypsometric Tinting: Color-Coded Elevation Zones
Hypsometric tinting transforms elevation data into intuitive visual representations using color gradients to distinguish height zones. This technique provides immediate elevation recognition across terrain surfaces without requiring detailed contour line interpretation.
Color Gradient Systems for Height Representation
Color gradient systems assign specific hues to elevation ranges using standardized scales that progress from sea level to mountain peaks. Traditional schemes employ green for lowlands transitioning through yellow and brown to white for highest elevations. Modern digital mapping tools like ArcGIS Pro and QGIS offer customizable gradient options including continuous ramps and discrete classification breaks. You’ll achieve optimal results by selecting 8-12 color classes that maintain sufficient contrast between adjacent elevation zones while preserving natural color associations.
Standardized Elevation Color Schemes
Standardized elevation color schemes follow established cartographic conventions that ensure consistent interpretation across different maps and applications. The International Cartographic Association recommends specific color progressions: deep green (below sea level), light green (0-200m), yellow (200-500m), orange (500-1000m), brown (1000-2000m), and white (above 2000m). USGS topographic maps utilize similar standards with slight variations for regional terrain characteristics. These standardized approaches eliminate confusion when comparing elevation data across multiple map sources or coordinate different mapping projects.
Combining Tinting with Other Mapping Techniques
Combining tinting with other mapping techniques creates comprehensive elevation visualizations that leverage multiple data representation methods simultaneously. Overlay hypsometric tinting with shaded relief to add three-dimensional depth perception while maintaining color-coded elevation zones. You can integrate contour lines at strategic intervals to provide precise elevation readings without overwhelming the color scheme. Modern GIS software enables transparency adjustments that blend tinting with satellite imagery or road networks. This layered approach proves particularly effective for hiking maps where you need both general elevation awareness and specific route-planning details.
Cross-Sectional Profiles: Elevation Along Specific Routes
Cross-sectional profiles slice through terrain data to reveal elevation changes along predetermined paths, providing essential linear perspective that complements area-wide visualization methods. You’ll find these profiles indispensable for route analysis and engineering applications where understanding vertical relationships proves critical.
Creating Elevation Transects and Route Profiles
Profile extraction begins with defining your route path using GPS coordinates or digitized lines in GIS software like ArcGIS Pro or QGIS. Modern tools automatically sample elevation values at regular intervals along your selected transect, typically every 10-50 meters depending on terrain complexity. You can generate profiles from various elevation data sources including 1-meter LiDAR datasets, 10-meter USGS DEMs, or 30-meter SRTM data, with higher resolution sources providing more detailed terrain representation for critical applications.
Analyzing Terrain Difficulty and Grade Changes
Grade analysis reveals slope percentages and elevation gain patterns that determine route difficulty and accessibility standards. You’ll identify steep sections exceeding 15% grade that require special consideration for trail design or vehicle access. Profile analysis also highlights elevation gain distribution, showing whether climbs occur gradually over long distances or concentrate in short, challenging segments. Terrain difficulty assessment combines grade measurements with total elevation change to classify routes according to hiking difficulty scales or engineering accessibility requirements.
Applications in Engineering and Trail Planning
Engineering applications utilize cross-sectional profiles for road design, pipeline routing, and construction feasibility studies where grade restrictions and cut-and-fill calculations prove essential. Trail planners rely on elevation profiles to design sustainable hiking routes that minimize erosion while maintaining reasonable difficulty levels for target user groups. You’ll also find profiles valuable for drainage analysis along linear features, identifying low points where water accumulates and determining optimal culvert placement for infrastructure projects requiring proper water management systems.
Spot Heights and Benchmarks: Precise Point Elevations
Spot heights and benchmarks deliver the most accurate elevation measurements available in traditional mapping systems. These precisely surveyed points anchor your elevation data with millimeter-level accuracy across landscapes.
Survey-Grade Elevation Reference Points
Survey-grade benchmarks establish permanent elevation control through monumented points with known coordinates. Professional surveyors place these markers using differential GPS and spirit leveling techniques that achieve vertical accuracies within 1-2 centimeters. You’ll find benchmarks embedded in concrete structures, rock outcrops, or specialized survey disks that resist environmental displacement. The National Geodetic Survey maintains over 740,000 benchmarks across the United States, providing reference datums for all subsequent elevation measurements in your mapping projects.
Integration with Contour and Digital Systems
Modern GIS workflows combine spot height data with contour lines and DEMs to enhance elevation accuracy. You can import benchmark coordinates directly into ArcGIS Pro or QGIS to validate your digital elevation models against ground-truth measurements. Survey-grade points serve as control nodes for TIN generation and contour interpolation algorithms, ensuring your derived elevation products maintain positional integrity. This integration process reduces systematic errors in your elevation datasets by anchoring computational models to verified reference elevations throughout your study area.
Historical Significance in Mapping Standards
Benchmark networks formed the foundation of national mapping programs throughout the 20th century before satellite positioning became available. The U.S. Coast and Geodetic Survey established the first comprehensive elevation control system in 1896, creating standardized vertical datums that remain active today. These historical reference points continue supporting modern mapping projects because they provide long-term stability measurements that satellite systems cannot match. Your elevation work connects to over 125 years of accumulated survey data when you incorporate established benchmarks into contemporary digital mapping workflows.
Conclusion
You now have seven powerful methods at your disposal for representing elevation data effectively. Each technique serves specific purposes and delivers unique advantages depending on your project requirements and visualization goals.
The key to successful elevation mapping lies in understanding when to use each method. You’ll find that combining multiple approaches often produces the most comprehensive results for complex terrain analysis.
Whether you’re planning hiking routes creating professional surveys or developing interactive applications these diverse elevation representation methods will enhance your mapping capabilities significantly. Choose the techniques that best align with your specific needs and technical expertise level.
Frequently Asked Questions
What are contour lines and how do they work?
Contour lines are foundational elements on topographic maps that connect points of equal elevation. They’ve been trusted for over two centuries to represent terrain on two-dimensional surfaces. Closer lines indicate steeper slopes, while wider spacing shows gentler gradients. The spacing patterns reveal critical terrain features like valleys and ridges, making them essential for hiking route planning and safety assessments.
What is a Digital Elevation Model (DEM)?
A Digital Elevation Model (DEM) is a grid-based dataset that provides precise elevation values at regular intervals, typically ranging from 1 to 30-meter resolution. DEMs store elevation data in uniform cell matrices and use processing algorithms to fill data gaps. They’re collected through LiDAR technology and satellite missions like SRTM and ASTER, offering global terrain coverage for advanced analysis.
How do shaded relief maps enhance terrain visualization?
Shaded relief maps transform flat terrain data into visually compelling three-dimensional representations through shadow simulation. They use hillshading algorithms that calculate shadow intensity based on surface angles and light source positioning. When combined with hypsometric tinting and contour lines, they create comprehensive visualizations that reveal terrain complexities better than contour lines alone.
What are three-dimensional terrain models used for?
Three-dimensional terrain models transform static elevation data into dynamic, explorable landscapes using Triangulated Irregular Networks (TINs). Modern software like ArcGIS Pro generates these triangular mesh structures with GPU-accelerated rendering for smooth navigation. They’re valuable for environmental impact assessments, military simulations, educational experiences, gaming, and virtual reality applications.
What is hypsometric tinting in mapping?
Hypsometric tinting uses color gradients to distinguish elevation zones, making terrain height intuitive to understand. Traditional schemes use green for lowlands, transitioning through yellow and brown to white for highest elevations. The International Cartographic Association recommends standardized color schemes for consistent interpretation. This technique works best when combined with shaded relief and contour lines.
How are cross-sectional profiles useful for terrain analysis?
Cross-sectional profiles slice through terrain data to reveal elevation changes along specific routes, providing essential linear perspectives. They’re created using GPS coordinates in GIS software, sampling elevation values at regular intervals. These profiles analyze terrain difficulty and grade changes, making them crucial for engineering projects, road design, pipeline routing, and sustainable trail planning.
What are spot heights and benchmarks?
Spot heights and benchmarks provide the most accurate elevation measurements in traditional mapping systems. Survey-grade benchmarks are permanent monumented points with known coordinates, achieving vertical accuracies within 1-2 centimeters. They establish elevation control for national mapping programs and integrate with contour lines and DEMs to enhance accuracy in modern GIS workflows and digital mapping projects.