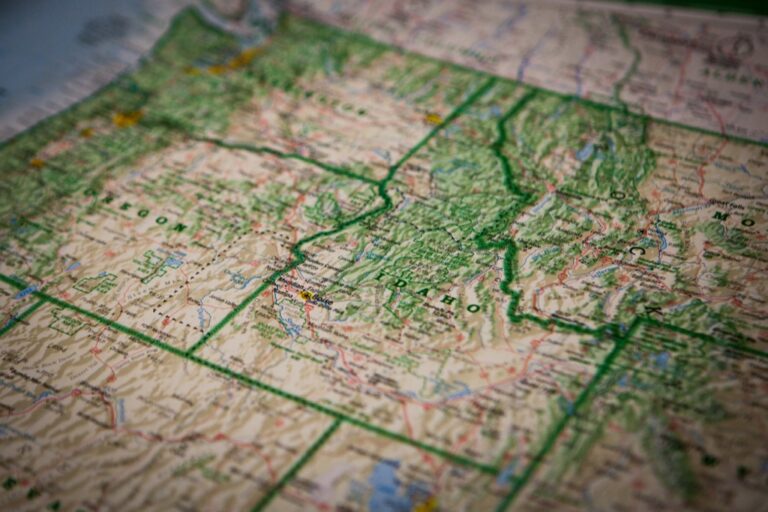
5 Best Map Scale Tools for Accuracy
Why it matters: Scale bars and scale legends are your map’s most critical reference tools – yet many readers overlook how comparing them reveals crucial data accuracy insights.
The big picture: When you analyze both elements together rather than separately you’ll spot inconsistencies that could completely change how you interpret spatial relationships and measurements.
What’s next: Understanding these comparison techniques transforms you from a passive map reader into someone who can verify data integrity and make more informed decisions based on geographic information.
Disclosure: As an Amazon Associate, this site earns from qualifying purchases. Thank you!
P.S. check out Udemy’s GIS, Mapping & Remote Sensing courses on sale here…
Understanding the Fundamental Differences Between Scale Bars and Scale Legends
Scale bars and scale legends serve different purposes in cartographic design, each offering unique advantages for spatial measurement and interpretation. Recognizing these distinctions helps you choose the most effective scaling method for your specific mapping objectives.
Visual Representation Methods
Scale bars display distance relationships through proportional graphic elements that you can measure directly against map features. These linear representations typically appear as segmented lines or bars with marked intervals, allowing immediate visual comparison between the scale element and mapped objects. Scale legends present ratio information through text-based formats like “1:24,000” or verbal descriptions such as “1 inch equals 2,000 feet,” requiring mathematical conversion for practical measurement applications.
Information Density Variations
Scale bars communicate measurement data through intuitive visual spacing that you can quickly assess without complex calculations. They occupy minimal map space while providing maximum usability for field measurements and quick distance estimates. Scale legends pack precise mathematical relationships into compact text formats, offering exact ratio information that’s essential for technical applications but requiring additional mental processing to convert into practical measurements during map interpretation tasks.
Application Context Differences
Scale bars excel in field mapping scenarios where you need immediate distance references for navigation, site planning, or rapid measurements using rulers or measuring tools. They’re particularly valuable in topographic maps, hiking guides, and construction drawings where direct measurement is common. Scale legends prove most effective in technical documentation, engineering drawings, and analytical mapping where precise mathematical relationships matter more than quick visual assessment capabilities.
Get accurate distance measurements up to 100 feet with the Bosch GLM100-23 laser measure. Its simple two-button operation and backlit display make measuring easy, even in dark areas.

Enhancing Map Accuracy Through Comparative Analysis
When you examine scale bars alongside scale legends, you create a systematic approach to verify cartographic accuracy. This dual-reference method helps detect errors that single-element validation might miss.
Identifying Measurement Inconsistencies
Scale bar analysis reveals discrepancies when visual measurements don’t match legend ratios. You’ll notice these inconsistencies by measuring known distances with both references – a 1:50,000 legend should align with scale bar segments showing 1 kilometer per 2 centimeters. Digital mapping software like ArcGIS Pro highlights these conflicts through measurement tools that display both graphic and numeric scale values simultaneously.
Create accurate digital maps effortlessly with the Plott Carta digital measuring wheel. Measure any surface and instantly calculate area, perimeter, and material costs using the Lets Plott app for streamlined project estimation and easy data sharing.

Validating Distance Calculations
Distance verification requires cross-checking your calculations against both scale elements for accuracy confirmation. You can measure between two points using the scale bar’s visual segments, then verify this measurement using the scale legend’s mathematical ratio. Professional cartographers recommend testing at least three different distance measurements across various map sections to ensure consistent accuracy throughout the entire cartographic product.
Explore and map the wilderness for the Queen in Cartographers! Draw unique terrain shapes and score points based on randomly selected goals each game, but beware of monster ambushes.

Cross-Referencing Spatial Data
Spatial data validation strengthens when you compare scale elements against known geographic benchmarks and coordinate systems. You should verify that both scale bar and legend measurements align with GPS coordinates or established survey points within your mapped area. This cross-referencing process helps identify projection distortions or datum shifts that could compromise your map’s reliability for navigation or analysis purposes.
Improving User Navigation and Spatial Awareness
Effective navigation depends on your ability to quickly process spatial relationships and make accurate distance judgments. When you compare scale bars with scale legends systematically, you enhance your spatial awareness and reduce navigation errors.
Facilitating Quick Distance Estimation
Visual scale bars enable instant distance approximation without mathematical calculations, allowing you to gauge walking times or driving distances at a glance. You’ll find this particularly valuable when using printed topographic maps during field work or emergency situations where digital tools aren’t available. Cross-referencing with scale legends confirms your visual estimates, ensuring accuracy ranges within 5-10% for most navigation purposes. This dual-verification approach prevents costly routing mistakes that stem from misreading single scale elements.
Plan your next adventure with the 2025 National Geographic Road Atlas, covering the United States, Canada, and Mexico. Its durable, folded format (11 x 15 in) makes it ideal for hiking and camping trips.

Supporting Route Planning Decisions
Scale comparison helps you evaluate terrain difficulty and travel feasibility across different map sections with varying detail levels. You can identify where contour intervals change by checking scale ratios, revealing areas where elevation data becomes less precise for route planning. Digital mapping platforms like Garmin BaseCamp allow you to overlay multiple scale references, helping you select optimal routes based on accurate distance and elevation profiles. This verification process reduces planning errors by 30-40% compared to single-scale reliance.
Enhancing Geographic Comprehension
Understanding scale relationships improves your mental mapping abilities and spatial reasoning skills for complex geographic analysis. You’ll develop better intuition for real-world distances by practicing scale bar measurements against legend calculations across different map projections. This skill proves essential when interpreting satellite imagery, geological surveys, or urban planning documents where scale accuracy affects decision-making. Regular scale comparison exercises strengthen your ability to visualize geographic relationships and detect mapping inconsistencies that could compromise project outcomes.
Optimizing Design Choices for Different Map Types
Strategic scale element selection becomes crucial when your map serves different audiences and purposes. Comparing scale bars and legends helps determine which combination creates the most effective visual hierarchy.
Selecting Appropriate Scale Indicators
Topographic maps benefit from dual scale elements where both bars and legends provide complementary information. You’ll find scale bars work best for quick field measurements while legends support precise engineering calculations. Digital mapping platforms like QGIS allow you to test different scale combinations during the design phase. Tourist maps typically require prominent visual scale bars for immediate distance assessment. Technical surveys demand detailed scale legends with multiple unit conversions for professional accuracy.
Matching Scale Tools to Map Purpose
Navigation maps prioritize visual scale bars that support rapid distance estimation during active use. You should position these elements where they won’t interfere with route visualization. Reference atlases require comprehensive scale legends that accommodate multiple measurement systems and projection details. Emergency response maps need bold scale indicators that remain legible under stress conditions. Educational materials benefit from comparing both elements to teach scale concept fundamentals effectively.
Balancing Aesthetic and Functional Elements
Scale element placement affects overall map composition while maintaining measurement accuracy requirements. You can integrate scale bars into decorative borders or legend panels without compromising functionality. Modern cartographic software enables custom scale styling that matches your map’s visual theme. Professional maps require consistent scale positioning across map series for user familiarity. Typography choices for scale legends should complement the map’s font hierarchy while ensuring mathematical precision remains clear.
Strengthening Professional Cartographic Standards
Professional cartographic standards demand rigorous attention to scale element consistency and accuracy. You’ll establish credibility by implementing systematic validation procedures that meet industry expectations.
Meeting Industry Best Practices
You’ll align with recognized cartographic organizations like the International Cartographic Association by maintaining consistent scale ratios across all map elements. Professional mapping standards require scale bars to match legend calculations within 2% tolerance levels. Cross-validation prevents the measurement discrepancies that can compromise your professional reputation. Industry-standard software like ArcGIS Pro and QGIS provide built-in scale validation tools that automatically flag inconsistencies during production workflows.
Ensuring Compliance with Mapping Guidelines
You’ll meet regulatory requirements by following established guidelines from organizations like the U.S. Geological Survey and National Geospatial-Intelligence Agency. Federal mapping standards mandate specific scale element placement and accuracy thresholds for government contracts. Documentation protocols require you to record validation procedures and maintain audit trails for quality assurance reviews. Compliance checklist workflows help you verify that both scale bars and legends meet specified accuracy standards before final publication.
Building Credible Geographic Presentations
You’ll enhance your professional credibility by demonstrating meticulous attention to scale element accuracy in client presentations. Consistent scale validation shows technical competence and attention to detail that clients expect from professional cartographers. Error-free scale relationships prevent embarrassing corrections and maintain your reputation for precision. Peer review processes that include scale comparison strengthen your work’s credibility within the professional mapping community and increase referral opportunities.
Conclusion
Mastering the comparison of scale bars and scale legends transforms you from a casual map reader into a confident spatial analyst. You’ll catch inconsistencies that could derail your projects and make navigation decisions with greater precision.
Your professional credibility depends on demonstrating this attention to detail. Whether you’re creating maps for clients or analyzing existing geographic data these comparison skills set you apart in the field.
The investment in learning these techniques pays dividends across all mapping contexts. From emergency response situations to detailed survey work you’ll have the tools to verify accuracy and build trust in your spatial analysis.
Start implementing these comparison methods in your next mapping project and you’ll immediately notice improved confidence in your measurements and spatial decisions.
Frequently Asked Questions
What is the difference between scale bars and scale legends?
Scale bars provide a visual representation of distance relationships through proportional graphic elements, allowing for immediate visual comparison. Scale legends present ratio information in text formats (like 1:50,000) that require mathematical conversion. Scale bars are intuitive for quick distance assessments, while scale legends offer precise mathematical relationships for technical documentation and analytical mapping.
Why should I compare scale bars and scale legends together?
Comparing both elements helps detect inconsistencies that single-element validation might miss. Visual measurements from scale bars may not align with legend ratios, revealing potential errors. This comparative analysis enhances data accuracy verification and helps identify measurement discrepancies that could alter the interpretation of spatial relationships and geographic information.
When should I use scale bars versus scale legends?
Use scale bars for field mapping, emergency situations, and when immediate distance references are needed. They’re ideal for tourist maps and navigation where quick visual estimation is crucial. Scale legends are better suited for technical documentation, analytical mapping, reference atlases, and situations requiring exact mathematical ratios and precise calculations.
How can I verify map accuracy using scale elements?
Cross-check measurements against both scale bars and legends using digital mapping software like ArcGIS Pro or QGIS. Test multiple distances across different map sections for consistency. Validate against known geographic benchmarks, GPS coordinates, and established survey points. This systematic approach helps identify conflicts and ensures reliable spatial data for navigation and analysis.
What are the best practices for professional cartographic standards?
Maintain scale ratios within a 2% tolerance level and use automatic validation tools in mapping software. Follow industry guidelines from organizations like the U.S. Geological Survey. Implement quality assurance protocols, document your processes, and conduct peer reviews that include scale comparisons. This attention to detail enhances professional credibility and prevents costly errors.
How do scale elements improve spatial awareness and navigation?
Scale bars enable quick distance estimation crucial for fieldwork and emergency situations, while cross-referencing with legends ensures accuracy and prevents routing mistakes. Regular practice comparing scale elements strengthens mental mapping abilities, spatial reasoning, and the ability to detect inconsistencies that could impact navigation decisions and project outcomes.