7 Effective Color Palette Choices for Maps That Enhance Readability
The big picture: Choosing the right colors for your maps can make or break how effectively your audience understands and engages with your data.
Why it matters: Poor color choices lead to confusion misinterpretation and accessibility issues that can undermine even the most valuable geographic insights.
What’s next: We’ll break down seven proven color palette strategies that professional cartographers use to create clear compelling and accessible maps that actually communicate your message.
Explore and map the wilderness for the Queen in Cartographers! Draw unique terrain shapes and score points based on randomly selected goals each game, but beware of monster ambushes.

Disclosure: As an Amazon Associate, this site earns from qualifying purchases. Thank you!
P.S. check out Udemy’s GIS, Mapping & Remote Sensing courses on sale here…
Understanding the Importance of Color Palettes in Map Design
Color palettes form the foundation of effective cartographic communication. Your color choices directly influence how viewers interpret spatial relationships, identify patterns, and extract meaningful insights from geographic data.
Achieve a flawless, even complexion with e.l.f. Flawless Satin Foundation. This lightweight, vegan formula provides medium coverage and a semi-matte finish for all-day wear, while hydrating your skin with glycerin.

Visual Hierarchy and Data Communication
Establishing clear visual hierarchy through color prevents data misinterpretation and guides viewer attention. Color intensity variations create natural reading paths, with darker tones typically representing higher values or greater importance. Sequential palettes like ColorBrewer’s Blues effectively communicate ordered data ranges, while diverging palettes highlight critical thresholds or break points. You’ll achieve optimal data communication by matching your color scheme to your data type—categorical data requires distinct hues, while continuous data needs gradual color transitions that reflect underlying numerical relationships.
User Experience and Accessibility Considerations
Accessible color design ensures your maps reach diverse audiences including colorblind users. Color vision deficiency affects approximately 8% of men and 0.5% of women worldwide, making accessibility crucial for professional mapping. Tools like Coblis simulator help you test palette effectiveness across different vision types. You should avoid red-green combinations and incorporate texture patterns or symbols alongside color coding. High contrast ratios between foreground and background elements improve readability, while maintaining sufficient color differentiation ensures all users can distinguish between map categories regardless of viewing conditions or display devices.
Sequential Color Palettes for Continuous Data
Sequential palettes use ordered color progressions to represent continuous data where values increase or decrease systematically. You’ll find these palettes essential when mapping phenomena like temperature, elevation, or population density across geographic areas.
Single-Hue Progressions for Temperature Maps
Single-hue progressions work exceptionally well for temperature mapping because they create intuitive visual relationships between color intensity and data values. You can use light blue to dark blue for cold temperatures or light red to dark red for heat measurements. This approach eliminates confusion since darker shades consistently represent higher values. Popular single-hue combinations include blues for precipitation data and oranges for drought conditions.
Multi-Hue Gradients for Elevation Data
Multi-hue gradients transition between different colors to represent elevation changes from sea level to mountain peaks effectively. You should start with greens for low elevations, progress through yellows and oranges for mid-range heights, then finish with browns and whites for highest peaks. ColorBrewer’s terrain palettes provide scientifically-tested combinations that ensure smooth transitions. These gradients help viewers immediately distinguish between valleys, hills, and mountainous regions.
Diverging Color Palettes for Comparative Analysis
Diverging color palettes excel at visualizing data with meaningful center points, allowing you to highlight deviations from neutral values or compare opposing conditions across geographic areas.
Red-Blue Schemes for Political Data
Red-blue diverging palettes effectively display political voting patterns and partisan data across electoral maps. You’ll achieve optimal results by placing neutral gray or white at the center point, representing competitive districts or swing areas. Position deep red for Republican-leaning areas and saturated blue for Democratic strongholds, creating intuitive visual associations that match established political color conventions. ColorBrewer’s RdBu palette provides scientifically-tested color combinations that maintain accessibility standards while clearly distinguishing between opposing political affiliations.
Organize your makeup collection with the Z Palette Deep Medium. This magnetic palette fits up to 15 standard eyeshadows and features a clear window for easy viewing, plus a durable design with included metal stickers for universal pan compatibility.

Temperature-Based Color Transitions
Temperature diverging palettes use cool-to-warm color progressions to display climate anomalies and thermal variations from baseline conditions. Deploy blue tones for below-average temperatures and red hues for above-average readings, centering white or pale yellow at your reference temperature. NOAA’s climate mapping standards recommend 11-class diverging schemes for temperature anomaly data, ensuring sufficient granularity without overwhelming viewers. These thermal color transitions work particularly well for seasonal comparison maps and climate change visualization projects.
Categorical Color Palettes for Distinct Classifications
Categorical color palettes serve as essential tools for mapping distinct, unrelated data categories where each color represents a separate classification without hierarchical relationships.
High-Contrast Schemes for Land Use Maps
High-contrast categorical schemes maximize visual separation between different land use classifications on your maps. You’ll achieve optimal distinction by selecting colors with significant lightness differences—pairing deep forest green for woodlands with bright yellow for agricultural areas and rich brown for urban zones. Professional cartographers recommend using ColorBrewer’s qualitative palettes, particularly the Set1 scheme, which provides eight highly distinguishable colors tested for accessibility. Avoid adjacent colors on the color wheel when mapping neighboring land uses to prevent visual confusion.
Complementary Colors for Administrative Boundaries
Complementary color pairs create striking visual contrast for administrative boundary maps while maintaining professional appearance standards. You’ll find that orange-blue combinations work exceptionally well for county-state relationships, with warm orange highlighting focal counties against cool blue state backgrounds. Purple-yellow schemes excel for district mapping, offering high contrast ratios that meet WCAG accessibility guidelines. Test your complementary choices using tools like Stark or Color Oracle to ensure visibility for users with color vision deficiencies, particularly when mapping critical administrative divisions.
Monochromatic Color Palettes for Elegant Simplicity
Monochromatic palettes rely on variations of a single color to create sophisticated maps that maintain visual coherence while effectively displaying data hierarchies. These single-color schemes eliminate the complexity of multi-hue combinations and provide professional-looking results.
Grayscale Variations for Professional Presentations
Grayscale palettes deliver exceptional clarity for formal presentations and reports. You’ll find these particularly effective for economic data, population density maps, and statistical visualizations where emphasis should remain on data patterns rather than color appeal. Professional cartographers recommend using 5-7 distinct gray values to maintain adequate contrast between categories. Black-to-white progressions work best for continuous data like income levels or educational attainment, while mid-gray starting points help highlight both positive and negative deviations in statistical mapping applications.
Single-Color Intensity Scaling
Single-color intensity scaling creates intuitive data relationships through familiar color associations. Blue intensity variations excel for water-related data like precipitation, flood risk, or hydrological studies, where darker blues naturally represent higher values. Green progressions work effectively for vegetation indices, agricultural productivity, or environmental health indicators. You can achieve optimal results by selecting ColorBrewer’s single-hue sequential schemes, which provide scientifically-tested color progressions that maintain perceptual uniformity across the value range while ensuring accessibility compliance for color vision deficiencies.
Analogous Color Palettes for Natural Harmony
Analogous color palettes use neighboring colors on the color wheel to create visually pleasing maps that mirror natural color relationships. These harmonious combinations reduce visual tension while maintaining clear data distinction.
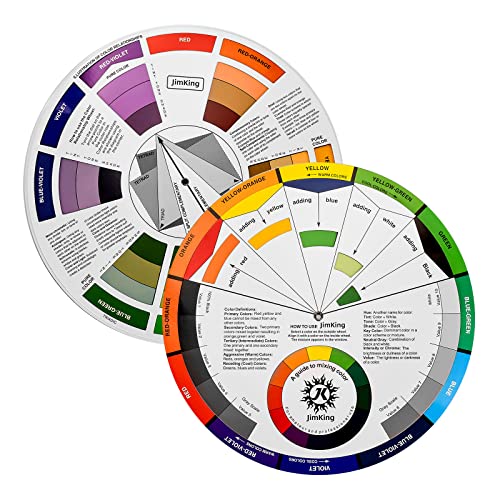
Easily organize and understand color relationships with this rotating color wheel. Ideal for artists and designers, it features a durable, UV-coated design for lasting use and clear color identification.
Earth Tones for Topographic Maps
Plan your next adventure with the 2025 National Geographic Road Atlas, covering the United States, Canada, and Mexico. Its durable, folded format (11 x 15 in) makes it ideal for hiking and camping trips.

Earth tones excel in topographic mapping by creating natural visual connections between elevation data and real-world terrain features. Brown-to-tan progressions effectively represent elevation changes, with darker browns indicating higher elevations and lighter tans showing valleys and lowlands. These palettes work particularly well for hiking maps and geological surveys where users expect natural color associations. You’ll find success using ColorBrewer’s brown sequential schemes, which offer 5-7 distinct values for clear elevation differentiation while maintaining perceptual uniformity across different viewing conditions.
Ocean Blues for Maritime Charts
Ocean blues provide intuitive depth representation for nautical charts and bathymetric maps through natural color progression from light to dark blue. Shallow waters appear in pale blue tones, while deep ocean areas display in navy or midnight blue, creating immediate depth recognition for mariners. These analogous blue schemes reduce cognitive load since users naturally associate darker blues with greater depths. Professional maritime cartographers recommend using NOAA’s standardized blue progressions, which ensure consistency across navigation charts while maintaining accessibility standards for color vision deficiencies commonly found in maritime professionals.
Custom Brand-Aligned Color Palettes for Corporate Maps
Corporate maps require color schemes that align with established brand identities while maintaining cartographic clarity and accessibility standards.
Company Color Integration Strategies
Primary brand colors serve as your foundation for corporate mapping projects. You’ll need to extract your company’s core brand colors from style guides and adapt them for geographic data visualization. Create secondary color variations by adjusting saturation and lightness levels to establish proper data hierarchies. Test these adapted colors against accessibility standards using tools like WebAIM’s contrast checker to ensure readability across all user groups.
Maintaining Brand Consistency Across Geographic Data
Consistent color application across multiple maps strengthens brand recognition while preserving data integrity. Establish a standardized color hierarchy that uses your primary brand colors for the most important data categories. Document these color assignments in a corporate mapping style guide that includes hex codes, RGB values, and specific use cases. Apply consistent legend formatting and typography that matches your brand guidelines while ensuring geographic data remains clearly interpretable.
Accessibility-Focused Color Palettes for Inclusive Design
Accessibility-focused color palettes ensure your maps reach the broadest possible audience while maintaining professional cartographic standards. These specialized color schemes accommodate various visual impairments and create inclusive geographic visualizations.
Colorblind-Friendly Palette Selection
Colorblind-friendly palettes eliminate problematic red-green combinations that affect approximately 8% of men and 0.5% of women globally. You’ll achieve optimal results using blue-orange, blue-yellow, or purple-green combinations that provide clear distinction for all color vision types. ColorBrewer’s colorblind-safe options include the “Set2” qualitative palette and “PuOr” diverging scheme, both tested against deuteranopia and protanopia conditions. Tools like Coblis and Stark help you simulate different color vision deficiencies during your design process.
High-Contrast Options for Visual Impairments
High-contrast options accommodate users with various visual impairments by maximizing luminance differences between map elements. You’ll need minimum contrast ratios of 4.5:1 for normal text and 3:1 for large graphics according to WCAG 2.1 standards. Black-to-white progressions provide maximum contrast for elevation data, while dark blue-to-bright yellow schemes work effectively for temperature variations. Test your palettes using WebAIM’s contrast checker or similar tools to verify compliance with accessibility guidelines before finalizing your map design.
Conclusion
Your color palette choices will ultimately determine whether your maps successfully communicate their intended message or leave viewers confused and disengaged. The seven strategies outlined here provide you with a professional framework for creating maps that are both visually compelling and highly functional.
Remember that effective cartographic design isn’t just about aesthetics—it’s about ensuring your geographic data reaches and resonates with your entire audience. By prioritizing accessibility alongside visual appeal you’ll create maps that serve diverse user needs while maintaining professional standards.
The tools and techniques you’ve learned here will help you avoid common pitfalls and create maps that truly enhance understanding of spatial relationships. Your investment in thoughtful color selection will pay dividends in clearer communication and more impactful data visualization.
Frequently Asked Questions
Why is color selection important for maps?
Color selection is crucial for maps because it directly impacts audience understanding and engagement with geographic data. Poor color choices can lead to confusion, misinterpretation, and accessibility challenges, ultimately diminishing the value of geographic insights. Proper color selection establishes visual hierarchy, guides viewer attention, and ensures that spatial relationships and data patterns are clearly communicated to all users.
What are sequential color palettes and when should I use them?
Sequential color palettes use color progressions to represent continuous data like temperature, elevation, or population density. They work by using color intensity to indicate data values, with lighter shades representing lower values and darker shades representing higher values. These palettes are ideal for mapping phenomena where there’s a natural progression from low to high values.
How do diverging color palettes work?
Diverging color palettes excel at visualizing data with meaningful center points, using contrasting colors to highlight deviations from neutral values. They typically feature a neutral color (gray or white) in the center with contrasting hues extending in both directions. These palettes are perfect for political maps, climate anomalies, and any data comparing opposing conditions across geographic areas.
Get durable, tear-resistant posters made in the USA. Each 18" x 29" poster features high-quality 3 MIL lamination for lasting protection.

What makes a color palette accessible?
Accessible color palettes avoid problematic red-green combinations that are difficult for colorblind users to distinguish. They maintain high contrast ratios (4.5:1 for normal text, 3:1 for large text) according to WCAG 2.1 standards and can be tested using tools like Coblis or Stark. Accessible palettes ensure maps are readable by users with various visual impairments and color vision deficiencies.
When should I use categorical color palettes?
Categorical color palettes are essential for mapping distinct, unrelated data categories where each color represents a separate classification without hierarchical relationships. Use high-contrast schemes for land use maps and complementary color pairs like orange-blue or purple-yellow for administrative boundaries. These palettes maximize visual separation between different classifications while maintaining accessibility standards.
What are the benefits of monochromatic color palettes?
Monochromatic color palettes use variations of a single color to create sophisticated maps with visual coherence while effectively displaying data hierarchies. Grayscale palettes work excellently for formal presentations and economic data, while single-color intensity scaling creates intuitive relationships through familiar color associations. These palettes are particularly effective for professional and academic presentations.
How can I align map colors with my brand?
Create custom brand-aligned color palettes by integrating company colors into mapping projects while maintaining cartographic clarity and accessibility standards. Develop secondary color variations, establish standardized color hierarchies, and document assignments in a corporate mapping style guide. Test all colors against accessibility standards and maintain consistent legend formatting that aligns with brand guidelines.