6 Best 3D Map Techniques for Digital Visualizations
Maps aren’t flat anymore. You’ve probably noticed how Google Earth’s 3D buildings make navigation feel more intuitive or how topographic maps with raised elevation help you understand terrain at a glance.
Learn essential map reading and navigation skills with this U.S. Army guide. Designed for practical use, it provides clear instructions for navigating any terrain.

Whether you’re designing interactive web maps for your business or creating compelling data visualizations for presentations you need to know how 3D elements can transform flat geographic data into engaging experiences that users actually want to explore.
Disclosure: As an Amazon Associate, this site earns from qualifying purchases. Thank you!
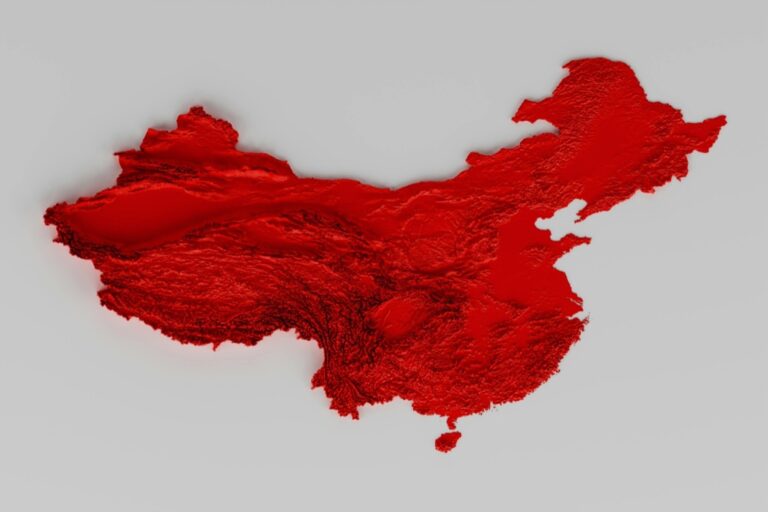
Extrusion Mapping for Building Heights and Terrain Elevation
Extrusion mapping transforms flat geographic data into three-dimensional representations by pushing building footprints and terrain features upward based on height attributes. This technique creates immersive urban environments and realistic landscape visualizations that communicate spatial relationships more effectively than traditional flat maps.
P.S. check out Udemy’s GIS, Mapping & Remote Sensing courses on sale here…
Creating Realistic Urban Skylines
Extrude building polygons using height data from sources like OpenStreetMap, municipal databases, or LiDAR datasets to create accurate urban skylines. Tools like Mapbox GL JS and Three.js allow you to apply building height attributes directly to polygon features, generating realistic cityscapes that reflect actual architectural density. You’ll achieve the most convincing results by combining building footprint data with precise height measurements, creating skylines that help users understand urban development patterns and neighborhood characteristics at a glance.
Representing Topographical Features
Transform elevation data into extruded terrain features using digital elevation models (DEMs) from sources like USGS or NASA SRTM datasets. Apply vertical exaggeration factors between 2-5x to emphasize subtle elevation changes that might otherwise appear flat, making mountain ranges, valleys, and coastal features more visually prominent. WebGL-based mapping libraries like Deck.gl excel at rendering large terrain datasets, allowing you to create compelling topographic visualizations that communicate landscape characteristics more effectively than contour lines alone.
Adjusting Scale and Proportions
Balance vertical exaggeration with horizontal scale to maintain realistic proportions while ensuring terrain features remain visible at your target zoom levels. Use different exaggeration factors for buildings (typically 1:1) versus terrain (2-10x) to prevent skyscrapers from appearing insignificant against dramatically elevated mountains. Test your extrusion settings across multiple zoom levels, adjusting height multipliers and base elevation offsets to ensure consistent visual hierarchy between urban structures and natural topography throughout your map’s interactive range.
Isometric Projection for Clear Dimensional Representation
Unlike traditional orthographic views, isometric projection eliminates perspective distortion while maintaining three-dimensional depth perception. This technique positions map elements at consistent angles that preserve true measurements across all visible surfaces.
Benefits of 45-Degree Viewing Angles
45-degree angles create uniform visual weight across building facades and topographic features. You’ll maintain equal visibility of building fronts and sides, allowing users to assess urban density patterns without perspective bias. This standardized viewing angle prevents smaller structures from disappearing behind larger ones while keeping rooftops clearly visible for comprehensive spatial analysis.
Maintaining Visual Clarity at Different Zoom Levels
Scale-dependent detail filtering ensures optimal readability as users navigate between city-wide and block-level views. You’ll implement progressive mesh simplification that removes minor architectural details at higher altitudes while preserving essential geometric relationships. Critical features like building heights and street widths remain proportionally accurate across all zoom ranges.
Combining 2D and 3D Elements Seamlessly
Layered rendering techniques blend flat cartographic symbols with dimensional geometry without visual conflicts. You’ll position street labels, transit icons, and administrative boundaries on elevated planes that float slightly above building surfaces. This approach maintains traditional map readability while incorporating 3D spatial context through carefully managed z-index hierarchies.
Shadow Casting for Enhanced Depth Perception
Shadow casting transforms flat map surfaces into visually compelling three-dimensional environments by simulating realistic lighting conditions. You’ll create natural depth cues that help users instantly understand elevation relationships and spatial hierarchies without relying solely on color coding or contour lines.
Implementing Dynamic Light Sources
Position your primary light source at a 45-degree angle from the northwest to create optimal shadow patterns that don’t interfere with text readability. Most GIS platforms like ArcGIS Pro and QGIS allow you to adjust azimuth and altitude settings within their 3D rendering engines. You can implement multiple light sources using ambient lighting at 30% intensity combined with directional lighting at 70% intensity to prevent harsh shadow edges that obscure important map features.
Creating Realistic Shadow Patterns
Calculate shadow length using elevation data and sun angle parameters to ensure proportional accuracy across your map extent. Digital elevation models (DEMs) with 10-meter resolution provide sufficient detail for realistic shadow casting in urban environments. You’ll need to apply ray-casting algorithms that trace light paths from your source through terrain and building geometries. Tools like Blender’s GIS add-ons or specialized mapping software can generate volumetric shadows that account for atmospheric scattering effects.
Adjusting Shadow Intensity for Optimal Readability
Set shadow opacity between 15-25% to maintain text legibility while preserving depth perception benefits. You’ll want to test shadow intensity across different zoom levels since dense urban areas require lighter shadows than rural terrain. Use gradient masks to soften shadow edges and prevent sharp contrast that interferes with street names or point-of-interest labels. Consider implementing adaptive shadow intensity that automatically adjusts based on underlying map content density and user-selected basemap themes.
Layered Transparency for Multi-Level Data Visualization
Layered transparency creates sophisticated data visualization by allowing multiple information layers to coexist without masking critical details. You’ll achieve compelling visual hierarchy while maintaining readability across complex datasets.
Stacking Information Layers Effectively
Order your layers from most to least important to establish clear visual hierarchy in your 3D map. Place base terrain at the bottom, followed by building footprints, transportation networks, and finally point-of-interest markers. You’ll maintain spatial context while allowing users to distinguish between different data types. Consider using thematic grouping where related datasets share similar transparency levels – for example, all infrastructure layers at 70% opacity and demographic overlays at 50% opacity.
Controlling Opacity Levels
Set opacity levels between 30-80% to maintain layer visibility without overwhelming the underlying geography. Use 80% opacity for primary data layers like building heights or population density, 60% for secondary information such as zoning boundaries, and 40% for reference layers like administrative boundaries. You’ll need to test opacity combinations across different zoom levels since transparency effects change with scale. Implement dynamic opacity controls that automatically adjust based on the number of active layers.
Preventing Visual Clutter Through Smart Layering
Apply conditional visibility rules to prevent information overload when multiple layers intersect. Hide low-priority layers when users zoom out beyond 1:50,000 scale, and use progressive disclosure to reveal detailed layers only at appropriate zoom levels. You’ll reduce cognitive load by implementing mutual exclusivity for similar data types – show either census tracts or ZIP code boundaries, not both simultaneously. Consider using graduated transparency where layer opacity decreases with distance from the user’s focus point.
Texture Mapping for Realistic Surface Details
Texture mapping transforms flat 3D geometric surfaces into photorealistic representations by wrapping detailed imagery and material patterns onto your map elements. This technique bridges the gap between abstract spatial data and tangible visual experiences that users can immediately recognize and navigate.
Applying Satellite Imagery Overlays
Satellite imagery overlays provide authentic ground-truth textures that reflect real-world surface conditions across your mapped terrain. You’ll achieve optimal results by sourcing high-resolution imagery from providers like Maxar, Planet Labs, or public repositories such as USGS Earth Explorer with pixel resolutions of 30cm or better. Apply these textures using UV mapping coordinates that align precisely with your elevation models, ensuring seamless transitions between adjacent image tiles. Configure your rendering pipeline to handle multiple resolution levels, switching from detailed 10cm imagery at street level to broader 1-meter resolution for regional views.
Incorporating Material-Based Textures
Material-based textures simulate specific surface properties like concrete, asphalt, vegetation, and water to enhance visual authenticity beyond simple photographic overlays. You can build comprehensive texture libraries using procedural generation tools like Substance Designer or source pre-built materials from repositories such as Poliigon and Textures.com. Apply different material properties based on land use classifications from OpenStreetMap or municipal GIS datasets, automatically assigning appropriate textures to residential, commercial, and industrial zones. Implement physically-based rendering (PBR) workflows that account for surface roughness, metallic properties, and normal mapping to create convincing material depth and lighting interactions.
Balancing Detail with Performance
Performance optimization requires strategic texture resolution management and efficient memory allocation to maintain smooth user interactions across various devices and zoom levels. Implement level-of-detail (LOD) systems that automatically reduce texture resolution based on viewing distance, using 4K textures for close-up views and 512×512 pixels for distant terrain. Apply texture compression formats like DXT5 or ASTC that reduce file sizes by 75% while preserving visual quality, and utilize texture streaming to load high-resolution details only when needed. Monitor GPU memory usage through browser developer tools, targeting maximum texture memory consumption below 512MB for mobile compatibility.
Interactive Camera Controls for Dynamic Viewing
Camera controls transform static 3D maps into exploratory environments where you can examine spatial relationships from every conceivable angle. These interactive systems give you the freedom to rotate, tilt, and zoom through geographic data with precision control.
Implementing Rotation and Tilt Functions
Rotation controls let you orbit around any point on your map using mouse drag or touch gestures. Set your rotation anchor to the map center for consistent navigation, with smooth interpolation preventing jarring movements. Tilt functionality adjusts the viewing angle from overhead to near-ground level, typically ranging from 0 to 85 degrees. You’ll want to limit extreme tilt angles to prevent disorientation while maintaining useful perspective views for terrain analysis.
Providing Smooth Zoom Transitions
Smooth zoom transitions use easing functions to create natural movement between scale levels rather than jarring jumps. Implement logarithmic zoom scaling to maintain consistent visual progression across all magnification levels. Level-of-detail switching should occur seamlessly during zoom operations, with texture and geometry updates happening imperceptibly. You’ll achieve the best results using momentum-based scrolling that continues briefly after user input stops, mimicking natural physics for intuitive interaction.
Offering Multiple Perspective Options
Preset viewing angles give you quick access to common perspectives like overhead, oblique, and ground-level views through dedicated buttons. Include compass-oriented views that automatically align north-up or user-defined orientations for consistent spatial reference. Saved viewpoints let you bookmark specific camera positions and smoothly transition between them, particularly valuable for presentations or guided tours. You can enhance user experience by providing flythrough animations between preset positions, creating cinematic transitions that maintain spatial context during navigation.
Conclusion
These six techniques give you the foundation to transform ordinary maps into immersive 3D experiences that captivate your users. Whether you’re building urban visualizations or terrain models you’ll find that combining these methods creates powerful mapping solutions.
Achieve a flawless, even complexion with e.l.f. Flawless Satin Foundation. This lightweight, vegan formula provides medium coverage and a semi-matte finish for all-day wear, while hydrating your skin with glycerin.

Remember that successful 3D mapping isn’t about using every technique at once. Start with one or two approaches that match your project’s goals then gradually layer in additional elements as needed.
The key lies in balancing visual impact with usability. Your users should feel empowered to explore spatial data naturally without getting overwhelmed by complex interfaces or heavy rendering loads.
As mapping technology continues advancing these techniques will remain essential building blocks for creating compelling geographic visualizations that truly engage your audience.
Frequently Asked Questions
What is 3D mapping and how does it differ from traditional flat maps?
3D mapping transforms flat geographic data into three-dimensional representations by adding height attributes to building footprints and terrain features. Unlike traditional flat maps, 3D maps provide depth perception and spatial context, making it easier to understand elevation changes, urban density, and terrain relationships through visual representation rather than symbols or contour lines.
What is extrusion mapping and how does it work?
Extrusion mapping elevates flat geographic elements based on height data to create 3D visualizations. It uses building height information from sources like OpenStreetMap and LiDAR to lift building footprints vertically, creating realistic urban skylines. The technique also applies to terrain features using digital elevation models (DEMs) to represent topographical variations.
How does isometric projection benefit 3D map visualization?
Isometric projection eliminates perspective distortion while maintaining three-dimensional depth perception. Using 45-degree viewing angles creates uniform visual weight across building facades and topographic features, allowing users to assess urban density patterns without perspective bias. This technique ensures consistent dimensional representation across the entire map view.
What role do shadows play in 3D map visualization?
Shadow casting enhances depth perception by simulating realistic lighting conditions, helping users understand elevation relationships and spatial hierarchies. Shadows are created using ray-casting algorithms with elevation data and sun angle parameters. A 45-degree primary light source angle creates optimal shadow patterns while maintaining text readability and visual clarity.
How can multiple data layers be displayed without creating visual clutter?
Layered transparency allows multiple information layers to coexist by controlling opacity levels and establishing visual hierarchy. Layers are ordered from most to least important, with specific opacity settings for different data types. Conditional visibility rules and progressive disclosure prevent information overload while maintaining focus on relevant data.
What is texture mapping in 3D cartography?
Texture mapping wraps detailed imagery and material patterns onto 3D geometric surfaces, transforming them into photorealistic representations. It uses satellite imagery overlays for authentic ground-truth textures and material-based textures that simulate specific surface properties, enhancing visual authenticity through procedural generation and physically-based rendering techniques.
How do interactive camera controls improve 3D map exploration?
Interactive camera controls transform static 3D maps into exploratory environments by allowing users to examine spatial relationships from various angles. Features include rotation and tilt functions for precise navigation, smooth zoom transitions between scale levels, and multiple perspective options for quick access to common views, creating intuitive user experiences.
What performance optimization strategies are important for 3D maps?
Performance optimization includes level-of-detail systems that adjust complexity based on zoom levels, texture compression formats to reduce memory usage, and progressive mesh simplification. These strategies ensure smooth user interactions across various devices while maintaining visual quality and preventing performance bottlenecks during real-time rendering.