7 Best Map Visualization Tools
Why it matters: Traditional maps and satellite imagery only scratch the surface when it comes to visualizing our planet’s diverse landscapes and geographic features.
The big picture: From ancient cartographic techniques to cutting-edge digital innovations you’ve probably never heard of geographic visualization has evolved far beyond standard topographical maps. Modern creators are pushing boundaries with everything from 3D terrain modeling to artistic interpretations that make complex geographical data both accessible and visually stunning.
Explore Texas with this comprehensive atlas. It features detailed topographic maps, back roads, and points of interest for outdoor enthusiasts.

What’s next: These seven alternative approaches will transform how you think about representing mountains valleys coastlines and other natural features whether you’re a student educator or professional working with geographic data.
Disclosure: As an Amazon Associate, this site earns from qualifying purchases. Thank you!
P.S. check out Udemy’s GIS, Mapping & Remote Sensing courses on sale here…
Create Interactive Digital Maps That Respond to User Input
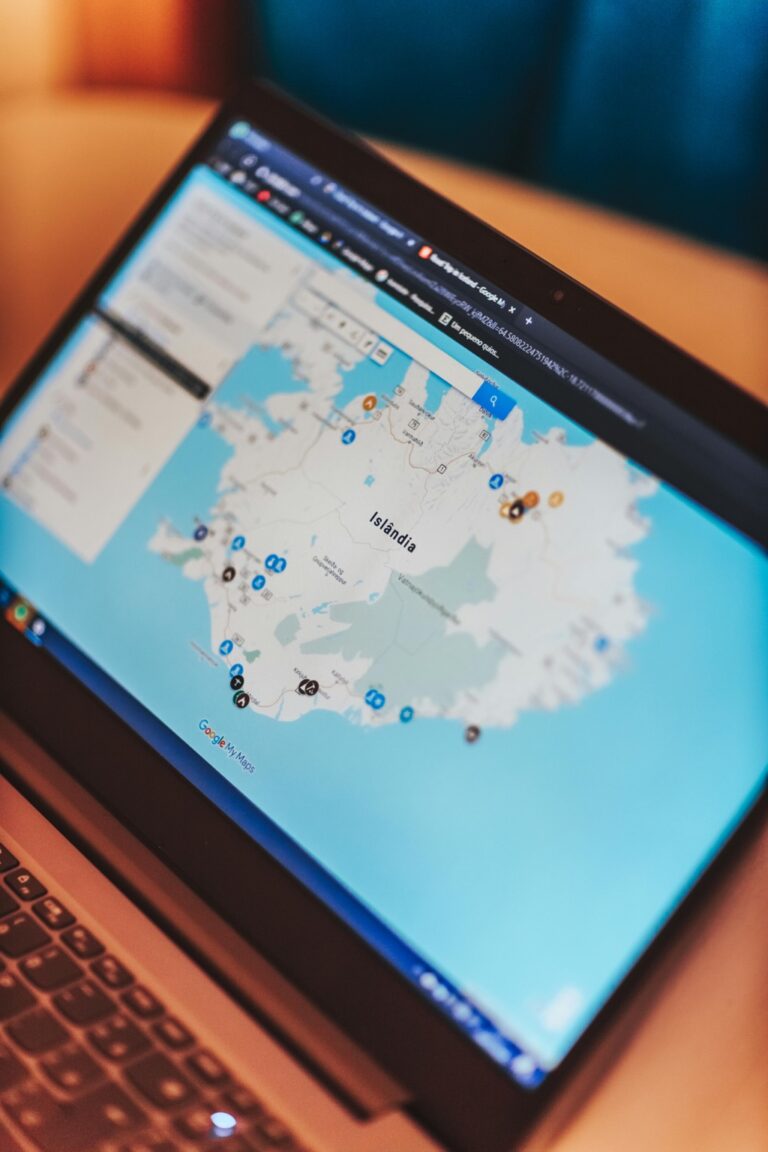
Interactive digital maps transform static geographic visualization into dynamic experiences that adapt to user needs. You’ll discover how modern web technologies enable real-time manipulation of geographic data layers.
Real-Time Data Visualization Layers
You can integrate live data streams directly into your mapping interface using APIs from weather services, traffic monitoring systems, and geological surveys. Tools like Mapbox GL JS and Leaflet support dynamic layer switching, allowing users to toggle between elevation models, precipitation data, and seismic activity feeds. Your maps become more valuable when they display current conditions rather than static snapshots. Consider implementing WebSocket connections for continuous data updates, particularly when mapping phenomena like wildfire spread or flood progression. Modern browsers handle multiple concurrent data streams efficiently, enabling smooth transitions between different temporal datasets.
Touch-Responsive Geographic Elements
You’ll enhance user engagement by implementing touch gestures that reveal detailed geographic information through direct interaction. JavaScript libraries like Hammer.js enable pinch-to-zoom functionality on terrain features, while tap events can trigger pop-up windows displaying elevation profiles or geological composition data. Your mobile users expect intuitive navigation through swipe gestures across mountain ranges and valley systems. Implement multi-touch support for comparing different geographic layers simultaneously, such as overlaying historical topography with current land use patterns. Touch-responsive elements work best when they provide immediate visual feedback, confirming user interactions with subtle animations or color changes.
Augmented Reality Overlays
You can superimpose digital geographic information onto real-world views using smartphone cameras and AR frameworks like ARKit or ARCore. Your users point their devices at landscapes to see elevation contours, trail markers, or geological formations highlighted in real-time. This technology proves particularly valuable for field research and educational applications where physical terrain needs digital annotation. Implement GPS positioning to ensure accurate overlay placement, accounting for device orientation and camera angle calculations. AR overlays work most effectively when they complement rather than obscure natural features, using semi-transparent graphics and clear visual hierarchies.
Experience vivid content on the Galaxy A16 5G's 6.7" display and capture stunning photos with its triple-lens camera. Enjoy peace of mind with a durable design, six years of updates, and Super Fast Charging.

Build Three-Dimensional Physical Models Using Natural Materials
Physical modeling brings geographic features into tangible reality, allowing you to create accurate topographic representations using materials found in nature. These hands-on construction methods offer spatial understanding that digital displays can’t match.
Clay and Sand Terrain Construction
Clay modeling provides exceptional flexibility for depicting elevation changes and landform transitions. You’ll shape wet clay to match contour data, building up mountain ranges and carving valleys with precise control over slope gradients. Mix different clay consistencies to represent varying soil types and geological formations. Sand construction works particularly well for coastal features and desert landscapes. Create layered sand formations using different grain sizes to show sedimentary deposits, then spray with diluted adhesive to preserve the structure for long-term display.
Wooden Relief Map Crafting
Wooden relief maps deliver permanent installations with professional-grade accuracy for educational and display purposes. You’ll cut multiple plywood layers matching elevation contours, then stack and glue them to create stepped terrain profiles. Use a router to smooth transitions between elevation zones, creating realistic slope gradients. Apply wood stain in varying intensities to represent different elevations – darker stains for valleys and lighter tones for peaks. Cedar and pine work best due to their workability and natural grain patterns that enhance topographic visualization.
Explore the United States with this 3D raised relief map. Feel the terrain and understand topography through its tactile, vacuum-formed design.

Stone and Rock Formation Displays
Natural stone assemblies create authentic geological representations that showcase Earth’s structural complexity. You’ll select rocks with similar mineral compositions to actual formations, arranging them to demonstrate folding, faulting, and stratification patterns. Use slate pieces for sedimentary layers, granite chunks for igneous intrusions, and marble fragments for metamorphic zones. Position stones at accurate dip angles using geological survey data, securing them with clear epoxy that maintains visual clarity while ensuring structural stability for handling during presentations.
Design Artistic Interpretations Through Visual Storytelling
Artistic interpretations transform geographic data into compelling visual narratives that connect emotionally with viewers. You’ll discover how creative approaches make complex landscapes more accessible through imaginative representation.
Watercolor Landscape Paintings
Create vibrant watercolor art with this portable set. It includes 40 colors (metallic & fluorescent), a brush pen, watercolor paper, and more, all in a stylish tin box.

Watercolor techniques capture the fluid nature of geographic features through transparent layers and organic color bleeding. You’ll achieve realistic terrain representation by building elevation through graduated washes, starting with light base tones for valleys and intensifying colors for mountain peaks. Professional artists use wet-on-wet applications for cloud formations and atmospheric effects, while controlled dry brush strokes define ridge lines and rock formations. Geographic accuracy remains essential even in artistic interpretation, requiring topographic reference maps to maintain proper scale relationships and elevation profiles throughout your composition.
Abstract Geographic Art Installations
Abstract installations distill geographic complexity into essential visual elements through geometric forms and symbolic representations. You’ll translate elevation data into sculptural height variations using materials like metal sheets, fabric panels, or suspended elements that respond to environmental conditions. Contemporary geographic artists employ color gradients to represent temperature zones, precipitation patterns, or geological age, creating immersive experiences that communicate spatial relationships without literal representation. These installations work particularly well in educational settings where visitors can walk through scaled geographic transitions and experience landscape changes through physical movement and sensory engagement.
Photography-Based Geographic Narratives
Photography sequences document geographic features through systematic visual storytelling that reveals landscape character over time and scale. You’ll create compelling narratives by capturing the same location across different seasons, weather conditions, or times of day to show environmental variation and change. Aerial photography combined with ground-level perspectives provides comprehensive geographic documentation, while macro photography of geological samples adds scientific detail to broader landscape stories. Professional geographic photographers use consistent framing techniques and standardized exposure settings to maintain visual continuity across image series, enabling viewers to understand complex environmental processes through sequential visual evidence.
Learn macro photography techniques with this guide. It provides clear instruction in English.

Develop Data-Driven Infographic Representations
Data-driven infographics transform raw geographic datasets into visually compelling representations that communicate complex spatial relationships at a glance. Professional cartographers increasingly rely on statistical visualization techniques to make geographic information accessible across diverse audiences.
Statistical Geographic Comparisons
Statistical comparisons reveal geographic patterns through side-by-side data visualization techniques. You’ll create compelling comparisons using bar charts that display elevation differences between mountain ranges, population distributions across urban centers, or agricultural output variations between regions. Tools like Tableau and Adobe Illustrator enable precise statistical mapping workflows. Consider using normalized scales when comparing regions of different sizes to maintain visual accuracy and prevent misleading interpretations.
Learn Adobe Illustrator with the 2025 release of this comprehensive guide. Master essential skills through hands-on lessons.

Population Density Visual Charts
Population density charts translate demographic data into immediately understandable visual formats using color gradients and proportional symbols. You can employ dot density maps where each dot represents specific population counts, or choropleth maps using color intensity to show density variations. ArcGIS Pro and QGIS offer sophisticated density visualization options including kernel density estimation and proportional symbol mapping. Always validate population data sources and census boundaries to ensure your density calculations reflect current demographic realities.
Climate Pattern Graphic Displays
Climate pattern displays synthesize meteorological data through multi-layered graphic representations that show temperature, precipitation, and seasonal variations simultaneously. You’ll combine isoline maps with color-coded temperature zones and precipitation symbols to create comprehensive climate portraits. Weather station networks and satellite data provide reliable source material for these visualizations. Use consistent color schemes following established meteorological conventions to maintain professional standards and ensure your climate graphics integrate seamlessly with existing weather communication systems.
Construct Sound-Based Geographic Experiences
Audio transforms geographic data into immersive experiences that engage multiple senses. Sound-based mapping creates spatial awareness through carefully crafted auditory elements.
Audio Landscape Tours
Guided audio experiences transport listeners through geographic regions using narration and ambient sound. You’ll record natural soundscapes like flowing rivers, wind patterns, and wildlife calls to represent specific terrain features. Professional audio software like Audacity or Pro Tools helps you layer environmental sounds with geographic explanations. Museums and educational institutions increasingly use these tours to make remote locations accessible. GPS-triggered audio apps allow visitors to experience location-specific content automatically as they move through mapped areas.
Musical Geographic Compositions
Musical compositions translate geographic data into structured audio experiences using elevation, climate, and terrain patterns. You can assign musical notes to different altitudes, creating melodies that rise and fall with topographic changes. Temperature variations become tempo shifts, while precipitation data influences rhythm patterns. Digital audio workstations like Ableton Live or Logic Pro enable precise data-to-music conversion. Geographic composers often use MIDI controllers to map multiple data layers simultaneously, creating complex soundscapes that represent entire ecosystems through harmonic structures.
Sound Effect Environmental Mapping
Environmental sound mapping uses specific audio cues to represent different geographic features and conditions. You’ll assign distinct sounds to wetlands, forests, urban areas, and mountain regions, creating audio signatures for each landscape type. Field recording equipment captures authentic environmental sounds that become your geographic audio library. Software like Reaper or Hindenburg Pro processes these recordings for consistency and clarity. Interactive sound maps allow users to click geographic regions and hear corresponding environmental audio, making spatial data accessible to visually impaired users.
Utilize Technology-Enhanced Virtual Reality Environments
Virtual reality transforms geographic visualization by creating immersive three-dimensional experiences that surpass traditional mapping limitations. You’ll discover how VR technology enables unprecedented exploration of terrain features through interactive digital environments.
Immersive Geographic Simulations
VR geographic simulations place you directly within realistic terrain environments using specialized headsets like Oculus Quest 2 or HTC Vive Pro. You’ll experience elevation changes firsthand as you navigate through digitally reconstructed landscapes based on LIDAR data and satellite imagery. These simulations incorporate real-world physics for authentic movement through valleys, across ridges, and over water features. Professional software like Unity 3D and Unreal Engine power these environments, enabling accurate scale representation and realistic lighting conditions.
360-Degree Virtual Landscape Tours
360-degree virtual tours provide comprehensive geographic perspectives through spherical video technology captured with specialized cameras like Insta360 Pro 2. You’ll access remote locations without physical travel, experiencing complete environmental immersion from fixed viewpoints throughout different terrains. These tours integrate with VR headsets and web browsers, allowing seamless navigation between geographic waypoints. Platforms like Google Earth VR and custom-built applications deliver high-resolution imagery that reveals topographic details invisible in traditional photographs.
Interactive VR Terrain Exploration
Interactive VR exploration enables real-time manipulation of geographic data layers while maintaining immersive visualization. You’ll adjust elevation scales, toggle geological formations, and examine cross-sectional views using hand controllers within the virtual environment. Advanced VR mapping platforms like ArcGIS Pro VR and Virtual GIS provide professional-grade tools for terrain analysis and spatial measurement. These systems integrate with existing GIS databases, allowing you to visualize complex geographic relationships through intuitive three-dimensional interfaces.
Incorporate Movement and Performance Art Elements
You can transform static geographic data into dynamic storytelling experiences through movement and performance art. These kinetic approaches create emotional connections between audiences and landscapes.
Dance-Based Geographic Storytelling
You’ll create powerful geographic narratives through choreographed movement that represents natural features and environmental processes. Professional dance companies like Alvin Ailey and Martha Graham have incorporated landscape themes into performances, using body movements to simulate water flow, mountain formation, and weather patterns. Modern choreographers translate topographic data into dance sequences, with dancers’ positions representing elevation changes and their movements depicting erosion, glacial flow, or tectonic shifts. You can collaborate with dance professionals to develop site-specific performances that bring geographic features to life through human expression.
Theater Productions Featuring Landscapes
You’ll engage audiences through dramatic presentations that place geographic features as central characters in theatrical narratives. Contemporary theater companies create immersive productions where actors portray rivers, mountains, and ecosystems, using staging techniques to represent geographic processes like volcanic eruptions or forest succession. Environmental theater groups perform in natural settings, allowing landscapes to serve as both backdrop and participant in the storytelling. You can develop scripts that personify geographic features, giving them voices to explain their formation, ecological relationships, and environmental challenges through dramatic dialogue and character development.
Live Action Geographic Demonstrations
You’ll bring geographic concepts to life through real-time physical demonstrations that simulate natural processes and landscape formation. Professional educators use sand tables, water flow models, and human participants to recreate river meandering, mountain building, and coastal erosion in front of live audiences. Geology museums employ staff demonstrators who use props, costumes, and interactive materials to explain plate tectonics, weathering processes, and climate patterns. You can design hands-on demonstrations where audience members participate in simulating geographic phenomena, creating memorable learning experiences that combine education with physical engagement and movement-based understanding.
Conclusion
These seven alternative visualization methods offer you powerful new ways to engage with geographic data beyond traditional mapping. Whether you’re creating interactive digital experiences or crafting physical models each approach brings unique advantages to your geographic storytelling toolkit.
You’ll find that combining multiple techniques often produces the most compelling results. Sound-based experiences paired with visual elements create memorable learning opportunities while performance art transforms abstract data into emotional connections.
The future of geographic visualization lies in your willingness to experiment with these diverse approaches. Start with one method that resonates with your goals and gradually incorporate others to build a comprehensive geographic communication strategy that truly captivates your audience.
Frequently Asked Questions
What are the main limitations of traditional maps and satellite imagery?
Traditional maps and satellite imagery often fail to capture the full complexity and beauty of Earth’s diverse landscapes. They present static, two-dimensional views that can make complex geographical data difficult to understand and less engaging for users, limiting their effectiveness in education and professional applications.
How do interactive digital maps enhance user experience?
Interactive digital maps transform static visualization into dynamic experiences by responding to user input in real-time. Using technologies like Mapbox GL JS and Leaflet, these maps integrate live data streams, allow manipulation of geographic data layers, and display current conditions, making geographic information more engaging and valuable.
What materials are used in physical geographic modeling?
Physical geographic modeling utilizes natural materials like wood and stone to create three-dimensional representations of terrain features. Wooden relief maps and stone displays showcase geological complexity, providing tangible spatial understanding that digital displays cannot match, making geographic concepts more accessible through touch and physical interaction.
How can art be used to represent geographic data?
Geographic data can be transformed into art through watercolor landscape paintings, abstract installations, and photography-based narratives documenting environmental change. These artistic interpretations make complex geographic information more accessible through visual storytelling, engaging audiences emotionally while conveying scientific data effectively.
What tools are commonly used for data-driven geographic visualizations?
Popular tools for creating data-driven geographic visualizations include Tableau and ArcGIS Pro. These platforms transform raw geographic datasets into visually compelling infographic representations, enabling precise mapping and clear communication of complex geographic information for both professional and educational purposes.
How does sound enhance geographic experiences?
Sound-based geographic experiences engage multiple senses through audio landscape tours and musical compositions that translate geographic data into structured audio experiences. This approach creates immersive environments that help users understand geographic concepts through auditory learning, complementing traditional visual methods.
What role does virtual reality play in geographic visualization?
Virtual reality creates immersive three-dimensional experiences that allow users to navigate realistic terrain environments and explore remote locations as if physically present. VR technology transforms geographic data into interactive experiences, providing unprecedented access to distant or inaccessible geographic features.
How can performance art represent geographic concepts?
Performance art transforms static geographic data into dynamic storytelling through dance-based geographic narratives, where choreographed movements represent natural features and environmental processes. Theater productions personify geographic features in dramatic narratives, while live demonstrations simulate natural processes for memorable learning experiences.