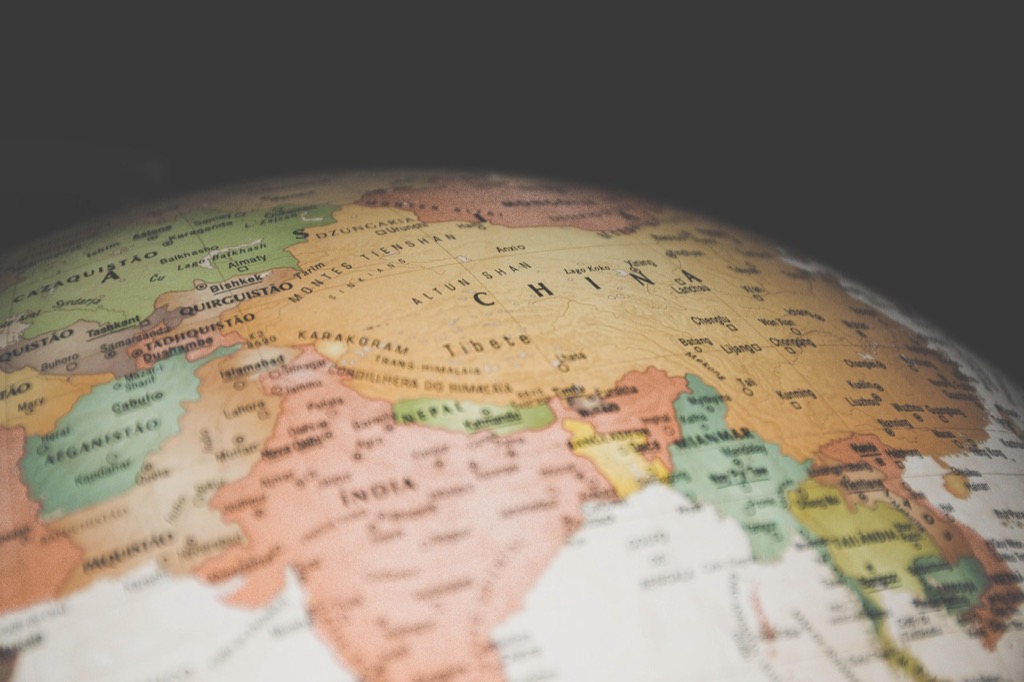
7 Best Abstract Map Designs for Visual Impact
You’ve probably seen countless traditional maps throughout your life but abstract map designs offer a refreshing departure from conventional cartography that transforms geographical data into stunning visual art. These experimental approaches blend creativity with functionality creating maps that don’t just show locations—they tell stories and evoke emotions through innovative design elements. Whether you’re a designer looking to push creative boundaries or simply curious about reimagining how we visualize space abstract maps open up exciting possibilities for your next project.
Disclosure: As an Amazon Associate, this site earns from qualifying purchases. Thank you!
Embrace Geometric Abstraction Through Simplified Shapes
You’ll discover that geometric abstraction transforms traditional cartographic elements into powerful visual statements. This approach strips away geographic complexity while maintaining spatial relationships that viewers can intuitively understand.
Convert Complex Landmasses Into Basic Polygons
Transform irregular coastlines and borders into clean geometric shapes using polygon simplification algorithms. Start with your base map data in QGIS or ArcGIS and apply Douglas-Peucker generalization at progressive tolerance levels. You’ll reduce vertex counts by 70-80% while preserving essential geographic relationships. This technique works particularly well for continental outlines and major water bodies where recognizable silhouettes matter more than precise boundaries.
P.S. check out Udemy’s GIS, Mapping & Remote Sensing courses on sale here…
Use Triangular and Hexagonal Grid Systems
Replace traditional coordinate systems with tessellated grids that create striking visual patterns across your map surface. Implement hexagonal binning in D3.js or R to aggregate point data into uniform cells that eliminate visual clustering bias. Triangular grids work exceptionally well for elevation data and network analysis, creating dynamic angular compositions. You’ll find these geometric frameworks particularly effective for demographic data visualization and spatial analysis presentations.
Apply Minimalist Color Blocking Techniques
Limit your palette to 3-5 carefully selected colors that create strong contrast without overwhelming spatial information. Use tools like ColorBrewer to select scientifically-tested color schemes that maintain accessibility standards. Apply single colors to entire administrative regions or elevation zones rather than gradient fills. This approach eliminates visual noise and forces viewers to focus on spatial patterns and relationships rather than decorative elements.
Transform Traditional Cartography With Artistic Typography
Typography becomes a powerful design element when you break away from standard cartographic text conventions. Artistic typography transforms abstract maps into dynamic visual compositions that communicate spatial relationships through creative letterforms.
Replace Geographic Names With Creative Font Experiments
You can substitute traditional place names with experimental typography that reflects each location’s character or function. Try using condensed sans-serif fonts for urban areas, flowing script fonts for rivers, and bold geometric typefaces for mountain ranges. Weight variations and letter spacing adjustments help distinguish different geographic features while maintaining spatial hierarchy. Consider custom lettering that mimics topographic contours or architectural elements specific to each region.
Integrate Text as Visual Elements Within Map Boundaries
Text integration transforms typography from labels into structural map components that define boundaries and fill spaces. You’ll achieve striking results by using text blocks to represent urban density, with tighter letter spacing indicating higher population concentrations. Rivers become flowing text streams using appropriate geographic terms, while forest areas fill with nature-related words in organic arrangements. This technique creates texture and meaning simultaneously within your abstract map framework.
Experiment With Layered Typography for Depth
Layered typography creates visual depth by stacking text elements at different opacities and scales across your map composition. You can establish foreground prominence using large, bold typography for major geographic features while background layers contain smaller, translucent text providing contextual information. Varying text angles and rotations add dimensional interest, particularly when you align typography with natural features like coastlines or mountain ridges. Multiple font weights within single text blocks enhance the three-dimensional effect.
Reimagine Scale and Proportion for Visual Impact
Breaking free from cartographic conventions opens new creative possibilities. You’ll discover how manipulating scale relationships transforms ordinary geographic data into compelling visual narratives.
Distort Geographic Accuracy for Aesthetic Appeal
Intentionally alter geographic proportions to create striking visual compositions that prioritize design over precision. Transform California’s coastline into flowing curves or compress the Great Lakes into perfect circles while maintaining recognizable spatial relationships. Apply anamorphic projection techniques using QGIS’s custom projection tools to stretch landmasses along specific axes. This approach works particularly well for wall art installations where emotional impact outweighs navigational accuracy. Consider population-based distortions where densely populated areas expand while rural regions contract, creating organic bubble-like territories that reflect human density patterns.
Emphasize Certain Regions Through Exaggerated Sizing
Amplify specific territories by increasing their visual footprint beyond geographic reality to direct viewer attention and convey importance. Enlarge Manhattan to match the visual weight of entire boroughs or scale up small island nations to compete with continental masses. Use Adobe Illustrator‘s transform tools to selectively resize polygons while maintaining their internal detail and texture patterns. This technique proves effective for economic data visualization where you’d expand financial centers like London or Tokyo to reflect their disproportionate global influence. Apply consistent scaling ratios across similar feature types to maintain visual coherence.
Learn Adobe Illustrator with the 2025 release of this comprehensive guide. Master essential skills through hands-on lessons.

Create Focal Points Using Disproportionate Elements
Deploy oversized geographic features as anchor points that establish visual hierarchy and guide reader navigation through your abstract composition. Transform rivers into bold highway-width corridors or inflate city markers into dominant circular zones that command immediate attention. Implement this using MapBox Studio’s symbol scaling functions to create multi-tiered visual importance levels. Strategic placement of these exaggerated elements creates natural reading paths across your map surface. Consider cultural landmarks like the Statue of Liberty or Golden Gate Bridge as candidates for dramatic size increases that serve both as wayfinding aids and symbolic representations.
Incorporate Mixed Media Elements Into Digital Mapping
Mixed media techniques transform sterile digital cartography into engaging visual narratives that blur the boundaries between traditional mapping and contemporary art.
Blend Hand-Drawn Illustrations With Digital Components
Hand-drawn illustrations inject personality into digital mapping workflows while maintaining technical accuracy. You’ll achieve compelling results by sketching topographic features in Adobe Illustrator using a Wacom tablet, then vectorizing these elements for seamless integration with GIS data layers. Consider drawing coastlines freehand to create organic curves that contrast sharply with precise coordinate-based boundaries, or sketch urban infrastructure using loose pen strokes that suggest movement and human activity rather than rigid geometric forms.
Create digitally with the Wacom Intuos Small Bluetooth Tablet. Enjoy precise pen-on-paper feel and customize your workflow with four ExpressKeys.

Add Textural Elements Like Fabric or Paper Collages
Textural elements create tactile depth that standard digital mapping cannot achieve through pixels alone. Scan fabric swatches, handmade papers, or weathered materials at 300 DPI, then apply these textures as overlay patterns using blend modes in Photoshop. You can map specific textures to geographic regions—burlap for agricultural areas, metal mesh for industrial zones, or aged parchment for historical districts. This technique works particularly well when combined with subtle transparency adjustments that allow underlying cartographic data to remain visible.
Create beautiful crafts with this A4 mulberry paper. Made from natural plant fibers, these sheets offer a unique texture perfect for painting, writing, decoupage, and more.

Combine Photography With Abstract Geographic Forms
Photography integration transforms abstract mapping into documentary storytelling while preserving spatial relationships. Capture aerial photographs or street-level imagery, then isolate specific elements like building silhouettes, natural textures, or infrastructure details for integration into simplified geographic shapes. You’ll create powerful visual connections by overlaying cropped photographs onto geometric representations of neighborhoods, using masking techniques to blend photographic reality with stylized cartographic abstraction that maintains both artistic impact and geographic accuracy.
Experiment With Unconventional Color Palettes and Gradients
Color choices define the emotional response your abstract map generates. Strategic palette selection transforms standard geographic data into compelling visual narratives that challenge viewer expectations.
Apply Monochromatic Schemes for Dramatic Effect
Monochromatic palettes create striking visual unity while maintaining clear spatial hierarchies. Choose a single hue and vary its saturation and brightness levels across different map elements. Deep navy blues work exceptionally well for coastal regions, allowing you to differentiate water bodies, urban areas, and transportation networks using only tonal variations. This approach forces viewers to focus on shape relationships rather than color coding, strengthening your abstract composition’s geometric impact.
Use Neon and High-Contrast Color Combinations
Neon color combinations like electric pink and cyan blue create futuristic map aesthetics that grab immediate attention. Pair complementary colors such as orange (#FF6B35) and electric blue (#00D4FF) to establish dramatic contrast between land and water features. These vibrant palettes work particularly well for urban mapping projects where you want to emphasize the energy of metropolitan areas. High-contrast schemes also improve accessibility by ensuring clear distinction between adjacent geographic elements.
Create Atmospheric Depth Through Gradient Transitions
Gradient transitions simulate atmospheric perspective by applying color temperature shifts across your map’s depth planes. Use warm colors (reds, oranges) for foreground elements and cool colors (blues, purples) for background features. Apply radial gradients to create focal points around major cities, transitioning from bright centers to muted edges. Linear gradients work effectively for elevation changes, shifting from warm valley colors to cool mountain tones while maintaining your abstract design principles.
Design Interactive and Layered Abstract Compositions
Interactive abstract maps transform static visualizations into dynamic experiences. You’ll create compelling spatial narratives through strategic layering and user engagement.
Build Multi-Level Visual Hierarchies
Establish clear information priorities using z-index positioning and visual weight distribution. Create primary layers with bold geometric forms while placing secondary data in subtle background elements. Use size variations where major cities appear 3x larger than regional centers and transportation networks span multiple opacity levels. Layer administrative boundaries beneath topographic abstractions to maintain spatial context without overwhelming primary content. Professional cartographers recommend testing hierarchy effectiveness through 5-second recognition tests.
Create Transparency Effects Between Map Layers
Apply strategic opacity controls to reveal underlying geographic relationships without sacrificing readability. Set water features at 60% transparency over terrain patterns and urban zones at 40% opacity when overlapping transportation corridors. Use blend modes like multiply for demographic overlays and screen for elevation gradients. Adobe Illustrator‘s transparency panel enables precise control over individual layer interactions. Successful transparency implementations maintain contrast ratios above 4.5:1 for accessibility compliance while preserving abstract design integrity.
Develop Modular Components for Dynamic Arrangements
Design reusable map elements that adapt to different scale requirements and thematic combinations. Create standardized symbol libraries with consistent proportions and modular road network segments that connect seamlessly across composition boundaries. Develop flexible boundary polygons that maintain visual coherence when grouped or separated. Use consistent anchor points and snap-to-grid systems for precise component alignment. Professional workflows benefit from establishing 12-column grid frameworks that accommodate both portrait and landscape orientations while preserving abstract design principles.
Push Boundaries With Non-Traditional Map Orientations
Traditional north-up orientations can limit your abstract map’s visual impact and narrative potential. Breaking free from conventional cardinal directions opens new possibilities for creative geographic storytelling.
Rotate and Flip Familiar Geographic Layouts
Rotate your base map 45 to 90 degrees to create unexpected visual dynamics that challenge viewer expectations. Flipping coastlines horizontally transforms California’s Pacific edge into an Atlantic-facing profile while maintaining recognizable geographic relationships. Apply rotation transformations in Adobe Illustrator using the Transform panel to achieve precise angular adjustments. Experiment with multiple rotation angles – 30-degree increments often produce the most striking results without losing spatial coherence. Consider how rotated layouts affect text placement and ensure labels remain readable after transformation.
Fragment Continuous Landmasses Into Separate Elements
Break large geographic features into discrete floating islands to emphasize individual regions and create visual breathing space. Fragmenting the continental United States into separate state clusters allows you to prioritize specific areas while maintaining overall geographic context. Use polygon splitting tools in QGIS to divide continuous boundaries along natural or administrative lines. Position fragmented elements with intentional gaps – typically 5-10% of the original landmass width – to maintain visual connection while creating distinct spatial zones. Maintain consistent fragment scaling to preserve relative size relationships between separated geographic elements.
Arrange Geographic Elements in Unexpected Configurations
Arrange familiar geographic shapes in grid patterns or circular compositions to transform traditional spatial relationships into structured visual frameworks. Positioning all 50 US states in alphabetical rows creates democratic geographic representation while breaking hierarchical spatial assumptions. Organize elements using systematic spacing – consistent margins of 20-30 pixels between shapes maintain visual order in unconventional layouts. Apply alignment tools in vector graphics software to ensure precise positioning across complex arrangements. Balance visual weight by distributing larger geographic elements throughout your composition rather than clustering them in single areas.
Conclusion
These seven abstract map design ideas unlock countless possibilities for transforming traditional cartography into compelling visual experiences. You’ve discovered how geometric abstraction mixed media integration and unconventional orientations can breathe new life into spatial data visualization.
Your next project doesn’t need to follow standard mapping conventions. Instead you can experiment with bold color palettes artistic typography and interactive layering to create maps that both inform and inspire. Each technique offers unique advantages whether you’re designing for urban planning data storytelling or pure artistic expression.
The key lies in balancing creative freedom with spatial clarity. Your abstract maps should challenge viewers’ expectations while maintaining enough geographic logic to remain functional and accessible to your intended audience.
Frequently Asked Questions
What are abstract map designs?
Abstract map designs are creative alternatives to traditional maps that transform geographical data into visual art. They blend creativity with functionality, displaying locations while telling stories and evoking emotions through innovative design elements. These maps prioritize artistic expression over strict cartographic accuracy while maintaining spatial relationships.
How do geometric abstraction techniques work in map design?
Geometric abstraction uses simplified shapes to create powerful visual statements while preserving intuitive spatial relationships. Techniques include polygon simplification algorithms to convert complex landmasses into basic forms, tessellated grid systems like hexagonal grids, and minimalist color blocking with limited palettes for strong visual contrast.
What role does typography play in abstract maps?
Typography transforms abstract maps into dynamic visual compositions by replacing traditional geographic names with creative font experiments that reflect location character. Text becomes structural components within map boundaries, with techniques like layered typography using varying opacities and scales to create visual depth and enhance overall composition.
How can scale and proportion be manipulated for visual impact?
Designers can break cartographic conventions by intentionally distorting geographic accuracy for aesthetic appeal. Techniques include anamorphic projection, population-based distortions, and exaggerating regions through increased visual footprints. This creates compelling visual narratives while maintaining recognizable spatial relationships and establishing clear focal points.
What mixed media techniques enhance abstract map design?
Mixed media approaches blend hand-drawn illustrations with digital components, adding textural elements like fabric or paper collages for tactile depth. Photography can be integrated with abstract geographic forms for documentary storytelling. These techniques inject personality while maintaining technical accuracy and preserving essential spatial relationships.
How do color choices affect abstract map design?
Unconventional color palettes and gradients evoke emotional responses and challenge viewer expectations. Monochromatic schemes create dramatic effects and clear spatial hierarchies. Neon and high-contrast combinations emphasize urban energy, while gradient transitions simulate atmospheric depth using warm foreground and cool background colors for enhanced visual impact.
What are interactive layered compositions in abstract mapping?
Interactive layered compositions use strategic z-index positioning and visual weight distribution to create multi-level visual hierarchies. Transparency effects reveal underlying geographic relationships without sacrificing readability. Modular components with standardized symbol libraries and flexible boundary polygons allow dynamic arrangements while maintaining visual coherence across compositions.
How can non-traditional map orientations enhance design?
Breaking free from conventional north-up layouts enhances visual impact by rotating familiar geographic layouts, fragmenting continuous landmasses, and arranging features in unexpected configurations. Tools like Adobe Illustrator and QGIS help maintain spatial coherence while exploring creative possibilities that challenge traditional cartographic conventions.