7 Best Mapping Techniques for Visual Impact
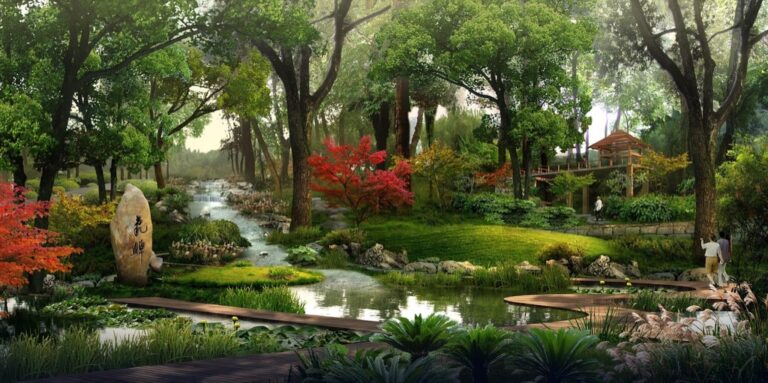
Maps have evolved far beyond simple navigation tools—they’re now powerful canvases where artistic creativity meets scientific precision. You’ll discover how modern cartographers blend data visualization with aesthetic design to create maps that don’t just inform but inspire and engage audiences on multiple levels.
The intersection of art and science in mapping opens up exciting possibilities for storytelling through geographic data. Whether you’re visualizing climate patterns through interactive installations or creating hand-drawn maps that highlight community stories these innovative approaches transform how we understand and connect with our world.
Disclosure: As an Amazon Associate, this site earns from qualifying purchases. Thank you!
Create Data Visualization Maps That Tell Scientific Stories
Building on the foundation of artistic mapping techniques, you can now leverage scientific data to create compelling visual narratives that communicate complex research findings through geographic representation.
P.S. check out Udemy’s GIS, Mapping & Remote Sensing courses on sale here…
Achieve a flawless, even complexion with e.l.f. Flawless Satin Foundation. This lightweight, vegan formula provides medium coverage and a semi-matte finish for all-day wear, while hydrating your skin with glycerin.

Transform Complex Research Data Into Visual Narratives
Transform your research datasets into compelling geographic stories by identifying key variables that have spatial relationships. Use temporal data layers to show scientific phenomena changing over time, such as climate patterns or species migration routes. Implement graduated symbols and proportional representations to make statistical relationships immediately apparent to viewers. Structure your data hierarchy to guide viewers through the scientific discovery process, starting with broad patterns and drilling down to specific findings that support your research conclusions.
Use Color Theory and Design Principles for Scientific Accuracy
Apply scientifically-appropriate color schemes that reflect natural phenomena, such as blue-to-red gradients for temperature data or green-to-brown transitions for vegetation indices. Ensure your color choices maintain accessibility standards while preserving data integrity through colorblind-friendly palettes. Balance visual hierarchy by using contrasting colors for different data categories and consistent symbology throughout your map series. Validate your color selections against established scientific visualization standards to maintain credibility and support accurate data interpretation across diverse audiences.
Design Interactive Maps Using Geographic Information Systems (GIS)
Interactive GIS mapping transforms static geographic data into dynamic visual experiences that engage users while maintaining scientific rigor. Modern GIS platforms provide the technical foundation for creating maps that respond to user input and reveal layered insights through exploration.
Incorporate Artistic Elements Into GIS Mapping Software
Customize symbology beyond default options to create visually compelling data representations. Use gradient fills, custom icons, and artistic textures within ArcGIS Pro or QGIS to enhance aesthetic appeal while preserving data accuracy. Apply artistic color palettes that reflect your data’s emotional context—warm tones for population growth or cool blues for water resources. Integrate hand-drawn elements by importing custom SVG symbols or digitizing artistic sketches as map overlays. Layer transparency effects create depth and visual hierarchy that guides user attention to key geographic patterns.
Develop User-Friendly Interfaces for Scientific Data Exploration
Build intuitive dashboards using ArcGIS Online’s Experience Builder or custom web applications that allow non-technical users to explore complex datasets. Design clear navigation menus with logical data categories and implement progressive disclosure techniques that reveal detailed information on demand. Create interactive legends that explain scientific methodology and data collection processes. Include time sliders for temporal data analysis and comparison tools that highlight geographic relationships. Test interface functionality with diverse user groups to ensure accessibility across different technical skill levels and screen readers.
Read comfortably with this lightweight, full-page 5X magnifying glass. Its large viewing area and ergonomic handle make it ideal for seniors and those with low vision to easily read small print.

Develop Hand-Drawn Scientific Maps With Artistic Flair
You’ll bridge the gap between scientific precision and artistic expression by creating hand-drawn maps that communicate complex data through visual storytelling. This approach transforms sterile datasets into engaging visual narratives that resonate with both scientific and general audiences.
Blend Traditional Cartographic Techniques With Modern Scientific Data
You can combine time-tested pen-and-ink techniques with contemporary GPS coordinates and satellite imagery to create scientifically accurate hand-drawn maps. Start by printing base layers from GIS software like QGIS or ArcGIS, then trace over them using traditional drafting tools like technical pens and watercolors. This method preserves the warmth of hand-drawn aesthetics while maintaining precise spatial relationships from your digital datasets.
Learn pen and ink techniques with this classic guide for artists, illustrators, architects, and designers. This book offers instruction on rendering methods.

Create Illustrated Field Guides and Research Documentation
Identify and use medicinal plants with this updated Peterson Field Guide. This edition covers Eastern and Central North America, featuring detailed descriptions and illustrations for easy identification.

You’ll enhance scientific documentation by incorporating hand-drawn elements into field guides and research reports. Use watercolor techniques to illustrate vegetation zones, sketch geological formations with cross-hatching methods, and create detailed species distribution maps with artistic flourishes. These illustrated guides serve as both scientific references and engaging educational materials that make complex research more accessible to diverse audiences.
Build 3D Topographic Art Installations for Environmental Science
Expanding beyond digital mapping, three-dimensional topographic installations transform environmental data into tangible experiences that engage both scientific and artistic communities.
Construct Physical Models That Showcase Geological Features
Create layered terrain models using laser-cut plywood or 3D-printed sections based on Digital Elevation Models (DEMs) from USGS databases. You’ll need to exaggerate vertical scales by 2-3 times to make subtle elevation changes visible in physical form. Sand and paint each layer to represent different geological formations, using earth tones that correspond to actual rock types. Mount your finished model on a rotating base with embedded LED strips to highlight fault lines, watershed boundaries, or erosion patterns for environmental research presentations.
Control these 100ft RGB LED strip lights via Bluetooth app or remote to customize colors and brightness. Sync them to music for a dynamic party atmosphere and set timers for automatic on/off.

Design Sculptural Maps for Educational and Research Purposes
Develop interactive installations that combine tactile mapping with environmental monitoring systems. Install pressure sensors beneath raised relief sections to trigger audio explanations of ecosystem changes or climate data when visitors touch specific geographic areas. You can incorporate real-time data feeds from weather stations or air quality monitors to create dynamic sculptures that change color or texture based on current environmental conditions. These installations work particularly well in museums, universities, and research centers where public engagement with scientific data enhances educational outcomes.
Get real-time weather data with the Ambient Weather WS-2902. This WiFi-enabled station measures wind, temperature, humidity, rainfall, UV, and solar radiation, plus it connects to smart home devices and the Ambient Weather Network.

Engineer Augmented Reality Maps for Scientific Education
Augmented reality mapping transforms static geographic data into interactive educational experiences that engage students with real-world scientific phenomena. You’ll create dynamic learning environments where complex datasets become accessible through immersive visualization.
Overlay Digital Scientific Information on Physical Landscapes
Position your mobile device or AR headset over physical terrain to superimpose real-time environmental data directly onto the landscape. Apps like ArcGIS Field Maps and ESRI’s AR capabilities let you overlay temperature gradients, soil composition data, or species distribution patterns onto actual field locations. You’ll visualize invisible phenomena such as electromagnetic fields, groundwater flow patterns, or air quality measurements by anchoring digital layers to GPS coordinates. Students can walk through ecosystems while seeing pH levels, nutrient concentrations, or biodiversity indices floating above corresponding terrain features.
Create Immersive Learning Experiences Through AR Technology
Develop interactive AR applications using Unity 3D and ARCore/ARKit frameworks to build educational mapping experiences that respond to student movements and gestures. You’ll program virtual field trips where students manipulate geological time scales by swiping through sedimentary layers or trigger climate change visualizations by pointing at specific geographic regions. Integrate sensor data feeds from weather stations, seismic monitors, or water quality sensors to display live scientific measurements within the AR environment. Students can collaborate on virtual mapping projects by sharing AR annotations and observations that persist across multiple devices and sessions.
Craft Artistic Infographic Maps for Scientific Communication
Transform complex research datasets into visually compelling geographic narratives that engage diverse audiences while maintaining scientific integrity.
Combine Statistical Data With Creative Visual Design Elements
Statistical visualization transforms raw numbers into geographic stories through strategic design choices. You’ll combine quantitative datasets with artistic elements like custom iconography, gradient color schemes, and proportional symbols that make data patterns immediately recognizable. Use tools like Adobe Illustrator alongside QGIS to create infographic-style legends that explain statistical relationships through visual metaphors. For example, represent population density data using artistic tree symbols where branch complexity indicates density levels, or transform climate data into watercolor-inspired temperature gradients that maintain scientific accuracy while creating emotional connection.
Develop Public-Friendly Scientific Information Displays
Accessibility drives effective scientific communication through simplified visual hierarchies and intuitive design patterns. You’ll create displays that translate technical jargon into everyday language while preserving data accuracy through clear labeling systems and contextual explanations. Design interactive elements like hover-triggered explanations for complex terms and multi-layered information reveals that let users choose their depth of engagement. Incorporate familiar visual metaphors – using house icons for demographic data or plant symbols for agricultural statistics – that help non-technical audiences immediately understand geographic relationships and scientific findings without compromising methodological rigor.
Produce Collaborative Art-Science Mapping Projects
Building upon individual artistic mapping approaches, collaborative projects unite diverse expertise to create maps that achieve both scientific rigor and artistic impact.
Partner Artists and Scientists for Interdisciplinary Research
Partner with research institutions to create maps that visualize ongoing scientific studies through artistic interpretation. You’ll establish formal collaborations where scientists provide datasets and research context while artists contribute visual storytelling techniques and creative design approaches. Document your collaborative process by maintaining shared project repositories where both teams can track data sources and creative decisions. Create structured workflows that respect scientific methodology while allowing artistic freedom in visual representation. These partnerships often produce maps for academic conferences, museum exhibitions, and public science communication campaigns that require both technical accuracy and visual appeal.
Document Community-Based Environmental and Social Studies
Document local environmental changes through community mapping initiatives that combine resident observations with scientific monitoring data. You’ll organize mapping workshops where community members contribute local knowledge about ecosystem changes, social patterns, and historical land use while scientists provide measurement tools and data validation methods. Create collaborative field mapping sessions using mobile GIS applications that allow real-time data collection from multiple participants. Develop community-accessible map formats that present scientific findings through locally relevant visual metaphors and cultural symbols. These projects strengthen environmental monitoring programs while building scientific literacy within communities.
Conclusion
The fusion of art and science in mapping opens up extraordinary possibilities for how you communicate and interpret geographic information. These innovative approaches transform traditional cartography into dynamic storytelling tools that resonate with diverse audiences.
When you embrace these creative mapping techniques you’re not just presenting data – you’re crafting experiences that make complex scientific concepts accessible and memorable. Whether through hand-drawn installations or augmented reality overlays each method offers unique advantages for engaging your specific audience.
The most impactful mapping projects emerge when you collaborate across disciplines bringing together artistic vision and scientific rigor. By experimenting with these seven approaches you’ll discover new ways to connect people with the world around them while maintaining the accuracy and credibility that effective communication demands.
Frequently Asked Questions
What is the evolution of modern cartography?
Modern cartography has evolved from basic navigation tools to sophisticated creations that merge artistic creativity with scientific accuracy. Contemporary cartographers now use data visualization and aesthetic design to create maps that inform, inspire, and engage audiences through storytelling and geographic data representation.
How can scientific data be transformed into compelling visual narratives?
Scientific data can be transformed into geographic stories by identifying key spatial relationships and using temporal data layers to show changes over time. This involves applying color theory, design principles, and appropriate color schemes while maintaining accessibility standards and visual hierarchy for accurate data interpretation.
What are the benefits of interactive GIS mapping?
Interactive GIS mapping transforms static geographic data into dynamic visual experiences that engage users while maintaining scientific rigor. It allows for customized symbology, artistic elements like gradient fills, and user-friendly interfaces with intuitive dashboards that make complex datasets accessible to non-technical audiences.
How do hand-drawn scientific maps enhance data presentation?
Hand-drawn scientific maps blend artistic expression with scientific precision, transforming sterile datasets into engaging visual narratives. They combine traditional cartographic techniques with modern data by using GIS software for base layers and traditional drafting tools for artistic enhancement.
What are three-dimensional topographic installations?
Three-dimensional topographic installations transform environmental data into tangible experiences using layered terrain models from laser-cut plywood or 3D-printed sections. These interactive sculptural maps can incorporate environmental monitoring systems and enhance public engagement with scientific data in educational settings.
How does augmented reality enhance scientific mapping?
AR mapping overlays digital scientific information onto physical landscapes, allowing students to visualize real-time environmental data like temperature gradients and species distribution patterns on-site. It enables immersive interaction with complex datasets through gesture-controlled climate visualizations and collaborative virtual mapping projects.
What makes artistic infographic maps effective for scientific communication?
Artistic infographic maps transform complex research datasets into visually compelling geographic narratives by combining statistical data with creative visual design elements. They use simplified visual hierarchies, intuitive design patterns, and visual metaphors to translate technical information into accessible formats for diverse audiences.
Why are collaborative art-science mapping projects valuable?
Collaborative art-science mapping projects unite diverse expertise to create maps with both scientific rigor and artistic impact. They foster partnerships between artists and scientists, enable community-based environmental mapping that combines local knowledge with scientific data, and enhance public understanding through participatory workshops.