6 Map Scale Techniques That Pro Cartographers Use
You’re likely familiar with maps but might not realize how dramatically different scale techniques can impact your understanding of geographic data. Map scale determines everything from the accuracy of distance measurements to how effectively you can navigate terrain or analyze spatial relationships.
This comparative analysis examines six fundamental map scale techniques that cartographers and GIS professionals use daily. You’ll discover which methods work best for specific applications and how choosing the wrong scale can lead to costly mistakes in navigation or analysis.
The bottom line: Understanding these six techniques will transform how you read interpret and create maps for any project or professional need.
Disclosure: As an Amazon Associate, this site earns from qualifying purchases. Thank you!
P.S. check out Udemy’s GIS, Mapping & Remote Sensing courses on sale here…
Understanding the Fundamentals of Map Scale Representation
Map scale representation forms the mathematical backbone of accurate cartographic communication. You’ll need to master these core principles before applying advanced scaling techniques in your mapping projects.
Defining Scale Ratio and Its Mathematical Foundation
Achieve a flawless, even complexion with e.l.f. Flawless Satin Foundation. This lightweight, vegan formula provides medium coverage and a semi-matte finish for all-day wear, while hydrating your skin with glycerin.

Scale ratio expresses the proportional relationship between map measurements and actual ground distances. You’ll encounter three primary formats: representative fraction (1:24,000), verbal scale (“one inch equals 2,000 feet”), and graphic scale bars. The representative fraction provides the most precise mathematical foundation, where 1:50,000 means one unit on your map equals 50,000 identical units on Earth’s surface. Professional cartographers rely on this numerical precision for survey-grade accuracy and legal documentation requirements.
Exploring the Relationship Between Map Distance and Real-World Distance
Map distance calculations require consistent unit conversion and scale factor application throughout your project. You’ll multiply measured map distances by the scale denominator to determine ground truth distances. For example, measuring 2.5 inches on a 1:24,000 topographic map equals 60,000 inches or 5,000 feet of actual terrain. Digital mapping software like ArcGIS Pro automatically handles these calculations, but understanding the underlying mathematics helps you verify accuracy and troubleshoot measurement discrepancies in field applications.
Analyzing the Representative Fraction Method
The representative fraction method stands as the most mathematically precise approach to scale representation in professional cartography. You’ll find this technique essential when working with survey-grade mapping projects that demand exact measurements.
Calculating Precise Numerical Ratios
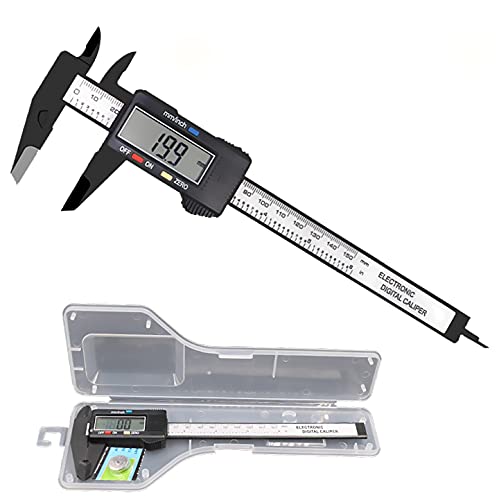
You calculate representative fractions by dividing map distance by ground distance using identical units. A 1:24,000 scale means one unit on your map equals 24,000 identical units on the ground. Convert all measurements to the same unit system before calculatingâinches to inches or centimeters to centimeters. You’ll achieve the highest accuracy by measuring distances with digital calipers and applying the ratio directly to your field calculations.
Get precise measurements with this durable stainless steel digital caliper. Easily switch between inch, millimeter, and fraction units on the large LCD screen for versatile use.

Advantages of Mathematical Accuracy in Professional Cartography
You gain unmatched precision with representative fractions because they eliminate interpretation errors common in verbal scales. Engineering firms rely on RF scales for boundary surveys where inch-level accuracy determines property lines worth thousands of dollars. You can convert RF scales between metric and imperial systems without losing mathematical integrity. GIS software processes RF scales directly, enabling automated distance calculations and spatial analysis workflows across multiple coordinate systems.
Limitations When Working With Non-Technical Audiences
You’ll encounter significant communication barriers when presenting RF scales to non-cartographers who struggle with ratio concepts. A scale of 1:63,360 means nothing to hikers who need practical distance references. Public-facing maps require verbal or graphic scales because general audiences can’t quickly convert mathematical ratios to real-world distances. You must provide supplementary scale bars or distance statements when RF scales are your primary measurement system for broader accessibility.
Examining the Graphic Scale Bar Technique
Graphic scale bars provide visual distance references that remain accurate when maps are reproduced at different sizes. You’ll find these linear measurement tools essential for maintaining scale integrity across various output formats.
Visual Representation Through Linear Measurements
Graphic scale bars display distance through segmented lines marked with real-world measurements. You can read distances directly by measuring map features against the bar segments. Standard configurations include primary divisions for major distances and secondary subdivisions for precise measurements. You’ll typically see alternating black and white segments that enhance readability under field conditions. The visual format allows immediate distance interpretation without mathematical calculations, making it accessible for users with varying technical backgrounds.
Benefits for Field Work and Navigation Applications
Field professionals rely on graphic scale bars for quick distance estimates during outdoor operations. You can use measuring tools like dividers or string to transfer map distances directly to the scale bar. GPS users benefit from instant verification of device readings against map measurements. The technique works effectively in low-light conditions where digital displays become difficult to read. Graphic scales remain functional when printed maps get wet or damaged, unlike digital alternatives that require device protection in harsh environments.
Get precise measurements with this digital caliper, featuring easy inch/millimeter conversion and a clear LCD display. Measure inner/outer diameters, depths, and steps with accuracy, plus enjoy automatic shutoff for extended battery life.
Challenges in Digital Mapping Environments
Digital mapping platforms create complications for graphic scale bar accuracy across different zoom levels. You’ll encounter scale distortion when users resize web maps or change display settings on mobile devices. Screen resolution variations affect the physical length of displayed scale bars, leading to measurement errors. Print-to-digital conversions require careful calibration to maintain accuracy. Interactive maps need dynamic scale bars that automatically adjust, but programming these features requires advanced technical implementation that many mapping applications lack.
Investigating the Verbal Scale Statement Approach
Verbal scale statements translate mathematical ratios into plain language expressions that describe distance relationships. This technique bridges the gap between technical precision and public understanding through natural language communication.
Converting Measurements Into Written Descriptions
Converting measurements into written descriptions requires translating representative fractions into everyday distance relationships. You’ll express ratios like 1:63,360 as “one inch equals one mile” for immediate comprehension. This conversion process involves identifying the most logical real-world distance that corresponds to a standard map measurement unit. You can create multiple verbal statements for different measurement preferences, such as “one centimeter equals 633.6 meters” alongside the inch-mile equivalent. Popular verbal scales include “one inch equals 2,000 feet” for urban planning maps and “one centimeter equals one kilometer” for regional atlases.
Effectiveness for Educational and Public Communication
Educational applications benefit significantly from verbal scale statements because they eliminate mathematical calculations for general audiences. You’ll find verbal scales particularly effective in classroom settings where students can immediately grasp distance relationships without converting fractions. Public-facing maps like tourist guides and park brochures use verbal statements to help visitors estimate walking times and travel distances. This approach works exceptionally well for emergency response maps where first responders need quick distance references during critical situations. Government agencies frequently employ verbal scales on zoning maps and public notice documents to ensure accessibility for property owners and community members.
Constraints in Precision and Technical Applications
Precision limitations emerge when verbal scales encounter measurement systems that don’t align with convenient real-world distances. You’ll struggle to create clean verbal statements for scales like 1:47,520, which translates to awkward expressions like “one inch equals 0.75 miles.” Technical surveying applications require exact measurements that verbal descriptions can’t provide with sufficient accuracy for legal documentation. Digital mapping environments present additional challenges because verbal scales become obsolete when users zoom or resize interactive maps. Engineering projects and cadastral mapping demand representative fractions or graphic scales rather than verbal approximations for boundary determination and construction layout precision.
Comparing Digital Interactive Scale Methods
Digital interactive mapping platforms revolutionize how you interact with scale information. These systems adapt scale representation in real-time as you navigate through different zoom levels.
Dynamic Zoom-Based Scale Adjustment Features
Dynamic scale bars automatically recalibrate as you zoom in and out of digital maps. Modern GIS platforms like ArcGIS Online and Google Earth Pro maintain accurate distance measurements by adjusting scale indicators continuously. You’ll notice scale values change instantly when zooming from city-wide views to street-level detail. This automatic adjustment prevents the distance measurement errors that plague static scale representations in digital environments.
User Experience Advantages in Modern Mapping
Interactive scale methods enhance navigation efficiency by providing immediate distance feedback during map exploration. You can measure distances by simply clicking two points, eliminating manual scale calculations entirely. Touch-based interfaces on mobile devices allow pinch-to-zoom functionality while maintaining scale accuracy. These systems accommodate users with varying technical backgrounds, from field technicians to casual map readers, making precise measurements accessible without cartographic expertise.
Technical Requirements and Accessibility Concerns
Interactive scale systems demand robust internet connectivity and modern browser capabilities to function properly. You’ll need JavaScript-enabled browsers and adequate processing power to handle real-time scale calculations. Screen reader compatibility becomes challenging with dynamic scale elements, requiring alternative text descriptions for visually impaired users. Legacy systems and older mobile devices may struggle with interactive features, necessitating fallback options like static scale bars for universal accessibility across different user environments.
Read comfortably with this lightweight, full-page 5X magnifying glass. Its large viewing area and ergonomic handle make it ideal for seniors and those with low vision to easily read small print.

Evaluating the Proportional Symbol Scale System
Proportional symbol mapping creates visual scale relationships through symbol size variations that directly correspond to data values. This technique transforms numerical data into intuitive visual representations.
Using Visual Elements to Represent Scale Relationships
Proportional symbols scale geometrically with data values, creating immediate visual comprehension of magnitude differences. Circle symbols work most effectively because users accurately perceive area relationships, while squares and triangles can distort perception. Symbol sizing follows mathematical formulas where area increases proportionally to data values, not diameter measurements. Professional cartographers typically apply square root scaling for circular symbols to maintain proper visual proportion. Color coding enhances symbol interpretation by adding categorical information alongside quantitative scaling.
Applications in Thematic and Statistical Mapping
Statistical mapping benefits significantly from proportional symbol techniques in population studies, economic analysis, and resource distribution visualization. Census data mapping uses proportional circles to show population density across metropolitan areas effectively. Economic indicators like GDP per capita display clearly through scaled symbols on country-level maps. Environmental data such as pollution levels, rainfall measurements, and species counts translate well into proportional representations. Multi-variable mapping combines symbol size with color gradients to show complex relationships between different datasets simultaneously.
Interpretation Challenges for General Users
General audiences struggle with accurate symbol size comparison, particularly when values differ by small margins or large ranges. Users tend to underestimate area differences between symbols, leading to misinterpretation of data relationships. Symbol overlap creates confusion in dense data areas where multiple features cluster together geographically. Legend design becomes critical because users need clear reference points for symbol size interpretation. Training materials often accompany proportional symbol maps in public applications to improve comprehension accuracy and reduce measurement errors.
Assessing the Comparative Grid Reference Technique
Grid reference systems provide coordinate-based scale determination through mathematical relationships between map coordinates and ground positions. This technique integrates seamlessly with modern surveying technologies while presenting varying complexity levels for different user groups.
Coordinate-Based Scale Determination Methods
Grid-based scale calculations use coordinate differentials to determine precise distance measurements between reference points. You’ll calculate scale by measuring coordinate distances on your map grid and comparing them to known ground distances between the same points. Universal Transverse Mercator (UTM) coordinates provide the most reliable foundation for these calculations, offering consistent scale factors across grid zones. State Plane Coordinate systems deliver superior accuracy for regional mapping projects, while Geographic Coordinate systems work effectively for large-scale continental applications requiring broad geographic coverage.
Integration With GPS and Surveying Technologies
Modern GPS receivers automatically provide coordinate-based scale verification through real-time positioning data that validates your map scale calculations. You’ll find that differential GPS systems achieve centimeter-level accuracy, making them essential for survey-grade scale determination projects. Total station instruments integrate directly with grid reference techniques, allowing you to establish control points with millimeter precision for large-scale mapping applications. GNSS networks provide continuous reference station data, enabling you to maintain consistent scale accuracy across extended mapping projects while reducing field survey time requirements significantly.
Get fast, accurate GPS positioning for your laptop, PC, car, or boat with this USB receiver. It features a high-performance chip for multi-GNSS support and a magnetic base for easy installation.

Complexity Factors for Different User Groups
Professional surveyors easily navigate coordinate transformations and datum conversions required for accurate grid reference scale applications in technical mapping projects. GIS analysts benefit from automated scale calculation tools within software platforms like ArcGIS and QGIS, which handle complex mathematical operations transparently. General map users struggle with coordinate system concepts and require simplified interfaces or conversion tools to apply grid reference techniques effectively. Educational applications need step-by-step calculation examples and visual aids to demonstrate coordinate-based scale determination methods for student comprehension and practical learning outcomes.
Conclusion
Understanding these six map scale techniques equips you with the tools needed to select the most appropriate method for your specific mapping requirements. Whether you’re working on technical surveys or creating maps for public audiences your choice of scale technique directly impacts both accuracy and user comprehension.
The digital revolution has transformed traditional scaling methods but hasn’t eliminated the need for fundamental scale knowledge. You’ll find that combining multiple techniques often produces the most effective results particularly when serving diverse user groups with varying technical expertise.
Your mapping projects will benefit from matching scale techniques to their intended purpose and audience. Professional applications demand mathematical precision while public-facing maps require intuitive visual elements that enhance user understanding without sacrificing essential accuracy.
Frequently Asked Questions
What is map scale and why is it important?
Map scale represents the mathematical relationship between distances on a map and corresponding distances in the real world. It’s crucial for accurate navigation, spatial analysis, and avoiding costly measurement errors in professional projects. Understanding map scale helps you read maps correctly, make precise distance calculations, and choose the right mapping technique for your specific needs.
What are the three main formats for representing map scale?
The three primary map scale formats are representative fraction (RF), verbal scale, and graphic scale bars. Representative fraction shows the ratio mathematically (like 1:24,000), verbal scale uses words (“1 inch equals 1 mile”), and graphic scale bars provide visual distance references through segmented lines with real-world measurements marked.
When should I use representative fraction versus other scale methods?
Use representative fraction for survey-grade accuracy and technical applications requiring precise measurements. It’s ideal for engineering projects, boundary surveys, and professional mapping. However, for public-facing maps or general audiences, consider graphic scale bars or verbal scales as they’re more intuitive and don’t require mathematical calculations to interpret distances.
How do graphic scale bars work and what are their advantages?
Graphic scale bars display distance through segmented lines marked with real-world measurements, allowing direct distance reading without calculations. They maintain accuracy when maps are reproduced at different sizes and work well in field conditions. They’re particularly useful for quick distance estimates and remain readable in low light or adverse weather conditions.
What are the benefits and limitations of digital interactive mapping scales?
Digital interactive mapping offers dynamic zoom-based scale adjustment, automatic recalibration, and immediate distance feedback through click-based interactions. However, they require robust internet connectivity, modern browser compatibility, and may present accessibility challenges for visually impaired users or those using legacy systems. They’re excellent for real-time navigation but depend on technology infrastructure.
How do proportional symbol scales help with data visualization?
Proportional symbol scales use variations in symbol size to represent data values, with larger symbols indicating greater magnitudes. They’re effective for thematic mapping like population studies or economic analysis. However, general users may struggle with accurately comparing symbol sizes, requiring clear legends and sometimes training materials for proper interpretation.
What is the grid reference technique and who should use it?
Grid reference technique uses coordinate-based scale determination through mathematical relationships between map coordinates and ground positions. It’s primarily suited for professional surveyors, GIS analysts, and those working with GPS technology. While highly accurate, it requires technical expertise and may need simplified interfaces for general map users.