7 Best Cartographic Techniques for Visual Storytelling
Maps tell stories beyond simple navigation â they reveal patterns expose connections and guide decisions across industries from urban planning to environmental science.
Creating compelling visual narratives in your cartographic projects transforms raw geographic data into powerful communication tools that engage audiences and drive action.
These seven innovative approaches will help you craft maps that don’t just show locations but tell meaningful stories that resonate with viewers and stakeholders alike.
Disclosure: As an Amazon Associate, this site earns from qualifying purchases. Thank you!
P.S. check out Udemy’s GIS, Mapping & Remote Sensing courses on sale here…
Storytelling Through Time: Creating Temporal Maps That Show Change Over Decades
Temporal mapping transforms static geographic data into dynamic stories that reveal how places evolve. You’ll capture decades of change through carefully designed time-based visualizations that engage viewers and communicate complex trends clearly.
Using Animation and Timeline Features
Animate your data sequences using tools like ArcGIS Pro’s Time Slider or QGIS Temporal Controller to show progressive changes smoothly. Create frame-by-frame animations that highlight urban expansion, deforestation, or climate shifts over multiple decades. Export your animations as GIF files or MP4 videos for web deployment, ensuring frame rates between 1-3 seconds per year for optimal viewer comprehension. Include clear temporal markers and consistent symbology throughout your animation sequence.
Incorporating Historical Data Layers
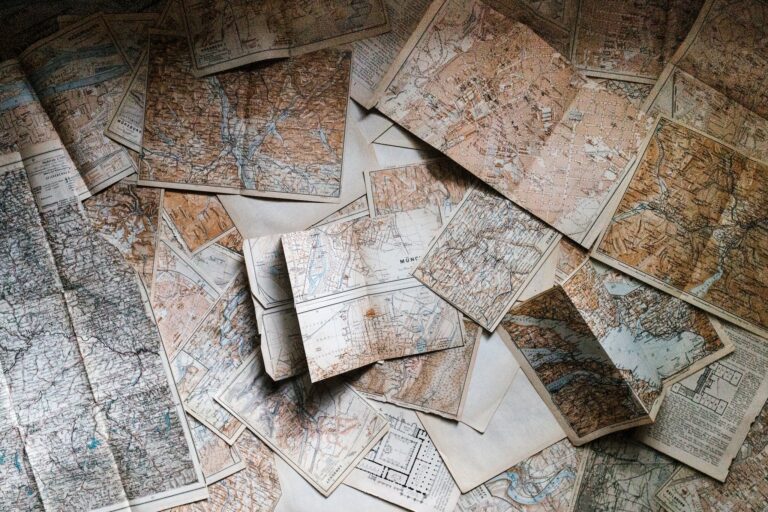
Layer historical datasets from sources like USGS historical topographic maps, aerial photography archives, and census boundary files to build comprehensive temporal foundations. Align coordinate systems across different time periods using geometric transformation tools in ArcGIS or QGIS. Digitize features from scanned historical maps when vector data isn’t available, maintaining consistent attribute schemas across all temporal layers. Archive quality metadata for each historical layer including accuracy assessments and data collection methods.
Learn essential map reading and navigation skills with this U.S. Army guide. Designed for practical use, it provides clear instructions for navigating any terrain.

Designing Before-and-After Comparisons
Structure side-by-side comparisons using identical map extents, scales, and symbology to eliminate visual bias between time periods. Create split-view layouts in your cartographic software with synchronized zoom and pan functions for interactive exploration. Use swipe tools or opacity sliders to reveal changes gradually, allowing viewers to control their discovery process. Apply consistent color schemes that highlight differences while maintaining visual harmony across both temporal states.
Journey Mapping: Visualizing Personal and Cultural Migration Stories
Journey mapping captures the human dimension of geographic movement, transforming migration data into compelling visual narratives that reveal both individual experiences and broader cultural patterns.
Plotting Individual Migration Paths
Plot migration routes using GPS trajectory data and personal documentation to create authentic movement visualizations. Connect waypoints with curved lines rather than straight paths to reflect actual travel routes and decision points. Use ArcGIS Pro’s curved connector tools or QGIS’s geometry generator to smooth pathway representations. Add temporal markers showing duration at each location and incorporate elevation profiles for overland journeys to provide geographic context that enhances narrative depth.
Highlighting Cultural Exchange Points
Identify cultural exchange nodes by analyzing population density data and historical settlement patterns at migration intersections. Mark these locations with graduated symbols sized by cultural diversity indices or interaction frequency. Layer demographic data from census sources with social media check-in data to validate contemporary exchange points. Use color-coded symbols representing different cultural groups and add popup annotations describing specific cultural contributions or fusion examples that occurred at each location.
Creating Interactive Family History Maps
Understand the structure of a one-hour TV drama pilot. This book provides a guide to story mapping for television.

Build interactive family trees using web mapping platforms like Leaflet or MapBox that connect genealogical data with geographic locations. Import family history databases and geocode birth, marriage, and death locations using batch processing tools. Design clickable markers that reveal family photos, documents, and timeline information. Implement filtering options by generation, surname, or date ranges and add migration path animations that show family dispersal patterns over multiple generations with synchronized storytelling elements.
Environmental Storytelling: Mapping Climate Change and Natural Disasters
Environmental mapping transforms climate data into compelling visual stories that connect scientific observations with human impact. You’ll create maps that reveal the urgent patterns driving our planet’s changing conditions.
Visualizing Temperature and Weather Pattern Changes
Temperature anomaly maps reveal climate shifts by comparing current readings against historical baselines using color gradients that progress from cool blues to intense reds. You’ll animate these datasets across decades to show warming trends, incorporating NOAA and NASA climate data for accuracy. Weather pattern visualization uses vector arrows and flow lines to display shifting precipitation patterns, storm tracks, and seasonal variations. Layer multiple timeframes to demonstrate how extreme weather events increase in frequency and intensity across specific regions.
Documenting Natural Disaster Impact Zones
Disaster impact mapping combines satellite imagery with damage assessment data to show before-and-after conditions using split-screen comparisons or opacity sliders. You’ll plot evacuation routes, emergency shelter locations, and infrastructure damage using standardized FEMA symbology. Recovery timeline maps track rebuilding progress through sequential phases, incorporating population displacement data and economic recovery indicators. Use choropleth mapping to display vulnerability indices that help communities prepare for future disasters based on historical patterns and geographic risk factors.
Tracking Species Migration and Habitat Loss
Migration route visualization plots animal movement patterns using GPS collar data and citizen science observations, connecting breeding and feeding grounds with curved pathway symbols. You’ll overlay habitat loss polygons using satellite-derived land cover change data from sources like Global Forest Watch. Biodiversity hotspot mapping combines species density data with threat assessment layers, using graduated symbols to show population changes over time. Create interactive range maps that demonstrate how climate zones shift northward, forcing species adaptation or extinction across fragmented landscapes.
Keep your dog safe with the Halo Collar 4, a GPS wireless fence and tracker. It uses dual-frequency GPS for accurate location and features customizable boundaries, activity tracking, and extended battery life.

Urban Evolution: Chronicling City Development and Infrastructure Growth
Urban cartography captures the dynamic transformation of metropolitan areas through strategic visual storytelling. You’ll create compelling narratives that showcase how cities expand, adapt, and modernize over decades of development.
Mapping Transportation Network Expansion
Transportation network mapping reveals urban connectivity evolution through systematic infrastructure documentation. You’ll track highway construction phases, rail line development, and public transit system expansion using historical transportation data layers. Overlay construction dates with population growth patterns to illustrate cause-and-effect relationships between accessibility and urban development. Use color-coded timeline visualization to show network phases, connecting major infrastructure projects with corresponding residential and commercial growth zones. This approach demonstrates how transportation investments drive metropolitan expansion patterns.
Visualizing Population Density Changes
Population density visualization transforms census data into dynamic urban growth narratives that reveal settlement patterns over time. You’ll create graduated symbol maps using decadal census data, showing population concentration shifts from urban cores to suburban peripheries. Compare density gradients across multiple time periods using heat map overlays that highlight growth corridors and declining neighborhoods. Incorporate dot density techniques for granular population distribution, connecting demographic changes with zoning modifications and infrastructure development. This method effectively communicates urban sprawl, gentrification patterns, and metropolitan area expansion.
Documenting Architectural and Landmark Development
Architectural mapping chronicles urban identity evolution through systematic building documentation and landmark development tracking. You’ll catalog construction dates for significant structures, creating temporal layers that show architectural style progression and urban skyline transformation. Use building footprint analysis with height extrusion to visualize three-dimensional urban development over decades. Incorporate historical photographs as map annotations, linking architectural milestones with corresponding neighborhood character changes. This technique reveals how landmark development influences surrounding property values, zoning decisions, and community identity formation.
Cultural Mapping: Exploring Social and Demographic Narratives
Cultural mapping reveals the invisible threads that weave communities together through demographic patterns and social identities. You can transform abstract social data into powerful visual stories that illuminate how cultures intersect and evolve within geographic spaces.
Visualizing Language Distribution and Diversity
Create language density maps using census data and linguistic surveys to reveal multilingual communities and language preservation patterns. Plot language boundaries with gradient overlays showing dominant languages transitioning into minority language enclaves. Use choropleth mapping techniques to display speaker population percentages across administrative boundaries. Include point symbols for language schools, cultural centers, and community organizations that support linguistic diversity. Incorporate ACS (American Community Survey) data layers to track language use trends over multiple census periods, revealing shifts in immigrant settlement patterns and intergenerational language retention rates.
Mapping Cultural Events and Festivals
Document cultural celebration locations using GPS coordinates and event attendance data to map community gathering spaces and cultural significance. Create seasonal overlay maps showing festival timing patterns, revealing how cultural calendars shape neighborhood activity cycles throughout the year. Plot vendor locations, performance stages, and parade routes to illustrate event infrastructure and community participation zones. Use heat mapping techniques to visualize attendance density and identify cultural hotspots within metropolitan areas. Connect festival data with demographic layers to analyze correlation between cultural events and population characteristics, highlighting how festivals serve as community identity markers.
Tracking Social Movement Origins and Spread
Trace protest locations and demonstration routes using crowd-sourced data and social media geolocation to map movement geography and activist network patterns. Create timeline animations showing how social movements expand from origin points through transportation corridors and communication networks. Plot key organizing locations including community centers, universities, and meeting spaces that serve as movement hubs. Use network analysis tools to identify influential nodes where multiple movement pathways converge. Overlay demographic data to analyze how social movements interact with population characteristics, revealing patterns of community engagement and resistance across different neighborhoods and socioeconomic zones.
Economic Geography: Telling Stories Through Trade Routes and Commerce
Economic narratives shape our understanding of regional development and global connectivity. Through strategic cartographic visualization, you’ll transform complex trade data into compelling stories that reveal how commerce drives geographic change.
Visualizing Historical Trade Networks
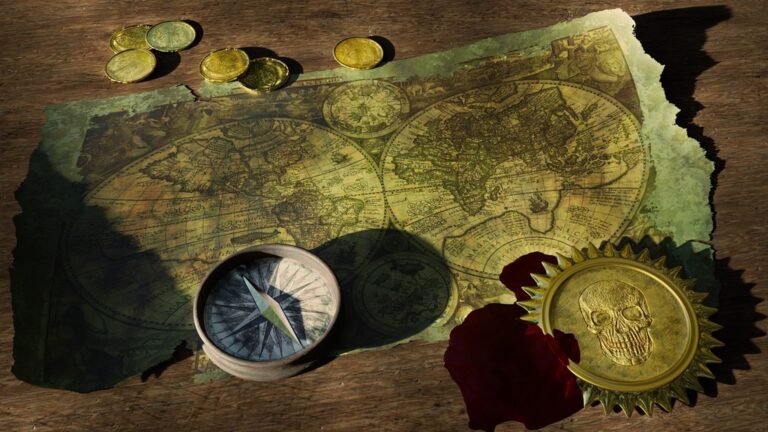
Mapping trade routes requires layering historical transportation data with commodity flow records. You’ll create multi-temporal visualizations using ship manifests and customs records from digital archives like HathiTrust or government repositories. Plot major ports as nodes with weighted connections representing trade volume, using line thickness to show cargo density over time. Incorporate elevation data to highlight how geographic barriers influenced route selection, particularly mountain passes and river crossings that became critical trade corridors.
Mapping Economic Development Zones
Economic development mapping combines census data with business registration records to reveal growth patterns. You’ll overlay industrial classifications from NAICS codes with employment statistics to identify emerging economic clusters. Use graduated symbols to represent job creation rates and color coding for industry sectors like manufacturing, technology, or agriculture. Track special economic zones and tax incentive areas using municipal zoning data, showing how policy decisions create geographic advantages that attract investment and reshape regional economies.
Tracking Resource Distribution and Access
Resource mapping requires integrating geological surveys with infrastructure data to show extraction and distribution networks. You’ll visualize mineral deposits using USGS databases combined with pipeline and transportation routes to reveal supply chain geography. Map energy infrastructure including power plants, transmission lines, and renewable installations using utility company datasets. Include population density overlays to highlight resource access disparities, particularly in rural areas where geographic isolation affects economic opportunity and development potential.
Conflict and Resolution: Mapping Human Stories of War and Peace
You’ll discover that conflict cartography transforms historical data into powerful visual narratives that reveal the human cost of war alongside the hope of peace. These maps serve as essential tools for historians, policymakers, and educators seeking to understand complex geopolitical events.
Documenting Battle Locations and Strategic Points
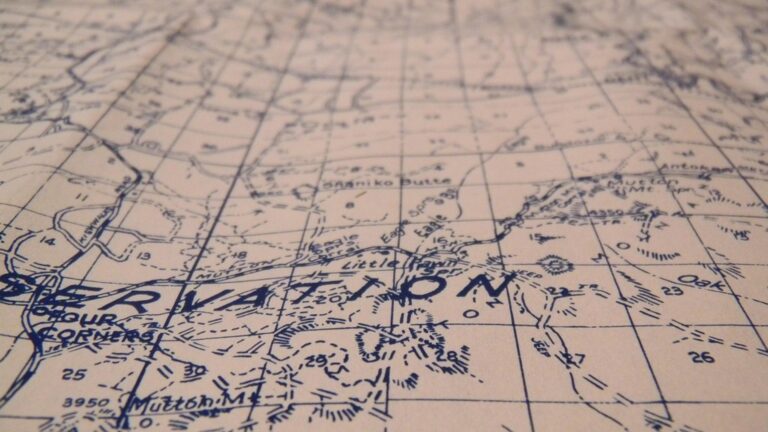
Document battlefields by combining historical military records with terrain analysis to create accurate tactical visualizations. You’ll need to layer elevation data with historical maps, positioning battle sites according to documented coordinates from military archives and archaeological surveys.
Explore history's most significant maps with *Great Maps*. This book delves into cartographic masterpieces and their historical context.

Overlay strategic infrastructure like bridges, supply routes, and defensive positions using period-appropriate symbols and colors. Cross-reference multiple historical sources to verify locations, as battlefield accounts often contain geographical inconsistencies that require careful data validation and expert historical consultation.
Visualizing Refugee Movement Patterns
Visualize displacement patterns by integrating UNHCR data with border crossing records and humanitarian aid distribution points. You’ll create flow maps using curved arrows to represent migration volumes, with line thickness corresponding to population numbers and colors indicating time periods.
Map refugee camps and temporary settlements alongside destination countries, highlighting transit routes through GPS tracking data when available. Include demographic breakdowns showing age groups, family compositions, and origin countries to reveal the human dimensions behind displacement statistics and settlement patterns.
Track vehicles and assets with the LandAirSea 54 GPS Tracker. Get real-time location alerts and historical playback using the SilverCloud app, with a long-lasting battery and discreet magnetic mount.

Mapping Peace Treaties and Territorial Changes
Map territorial changes by creating before-and-after boundary comparisons using historical treaty documents and surveyed border data. You’ll overlay negotiated zones, demilitarized areas, and contested regions using distinct symbology that clearly differentiates between official boundaries and disputed territories.
Timeline your maps to show progressive treaty implementations, incorporating ratification dates and territorial exchanges. Combine diplomatic records with ground-truth verification data, ensuring accuracy in boundary representations while highlighting areas where peace agreements successfully resolved long-standing territorial disputes.
Conclusion
These seven visual narrative approaches will transform your cartographic projects from simple data displays into compelling storytelling tools. You’ll discover that maps become more powerful when they reveal human experiences behind geographic patterns and temporal changes.
Your audience will connect more deeply with visual narratives that combine historical context with contemporary data. Whether you’re documenting urban growth or tracking environmental changes these techniques will help you create maps that resonate with viewers on both intellectual and emotional levels.
The key to successful cartographic storytelling lies in choosing the right narrative approach for your specific data and audience. You’ll find that combining multiple techniques often produces the most engaging results while maintaining clarity and scientific accuracy.
Frequently Asked Questions
What is the main purpose of modern cartography beyond basic navigation?
Modern cartography serves multiple purposes beyond navigation, including uncovering patterns, highlighting connections, and informing critical decisions across various fields like urban planning and environmental science. Maps transform raw geographic data into engaging visual narratives that effectively communicate complex information to audiences and stakeholders.
How does temporal mapping work and what can it show?
Temporal mapping transforms static geographic data into dynamic stories that reveal how places evolve over time. It uses techniques like animation, timeline features, and historical data layers to visualize changes such as urban expansion, climate shifts, and demographic transitions through smooth, engaging visualizations.
What is journey mapping and how does it capture human experiences?
Journey mapping captures the human dimension of geographic movement by transforming migration data into compelling visual narratives. It plots individual migration paths using GPS data, connects waypoints with curved lines to reflect actual travel routes, and identifies cultural exchange points to reveal both personal experiences and broader cultural patterns.
How can maps be used for environmental storytelling?
Environmental storytelling uses maps to illustrate climate change and natural disasters by transforming climate data into visual narratives. This includes creating temperature anomaly maps, weather pattern visualizations, disaster impact mapping with satellite imagery, and tracking species migration and habitat loss to enhance understanding of environmental challenges.
What does urban evolution mapping reveal about cities?
Urban evolution mapping chronicles city development and infrastructure growth through visual storytelling. It reveals urban connectivity evolution by mapping transportation network expansion, visualizes population density changes over time, and documents architectural and landmark development to showcase how urban identity evolves.
How does cultural mapping help understand communities?
Cultural mapping reveals the invisible threads that weave communities together by visualizing demographic patterns and social identities. It creates language density maps for multilingual communities, maps cultural events and festivals to show community gathering spaces, and tracks social movement origins to understand how cultural dynamics shape geographic spaces.
What insights does economic geography mapping provide?
Economic geography mapping tells stories through trade routes and commerce by visualizing historical trade networks, mapping economic development zones, and tracking resource distribution. It combines transportation data with commodity flows, reveals growth patterns through census and business records, and highlights disparities in resource access across regions.
What is conflict cartography and what does it document?
Conflict cartography transforms historical data into visual narratives that reveal the human cost of war and hope of peace. It documents battle locations using military records and terrain analysis, visualizes refugee movement patterns through flow maps, and maps peace treaties and territorial changes to illustrate diplomatic impacts.