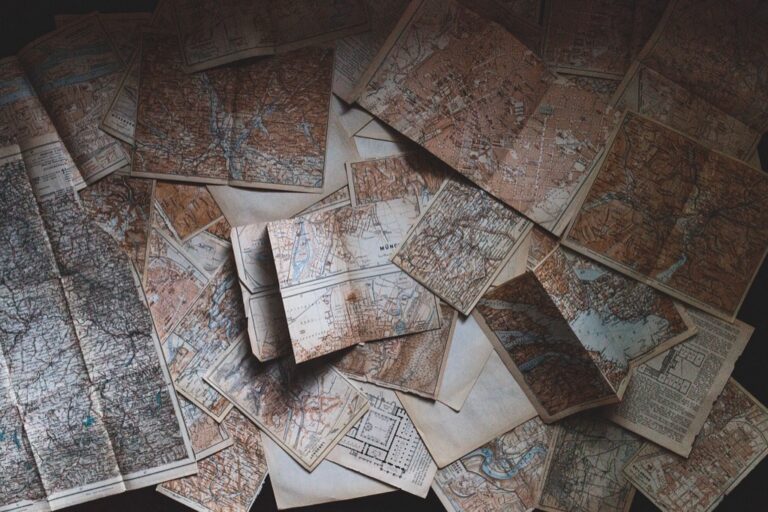
7 Best Map Design Elements for Immersive Navigation
Why it matters: Traditional maps rely solely on visual elements but incorporating sensory design transforms how you experience and understand geographic information.
The big picture: Modern map designers are breaking boundaries by integrating tactile textures sound cues and even scent markers to create multi-dimensional navigation experiences that engage all your senses.
What’s next: These seven innovative approaches will revolutionize how you think about spatial representation and make maps more accessible inclusive and memorable for every user.
Disclosure: As an Amazon Associate, this site earns from qualifying purchases. Thank you!
P.S. check out Udemy’s GIS, Mapping & Remote Sensing courses on sale here…
Use Tactile Textures to Represent Different Terrain Types
Physical textures transform flat maps into multi-dimensional navigation tools that users can explore through touch. You’ll create more inclusive and memorable mapping experiences by incorporating tactile elements that correspond to real-world terrain characteristics.
Incorporate Raised Relief for Mountain Ranges
Elevation mapping becomes intuitive when you apply dimensional materials like foam board or thermoplastic sheets. Layer different heights to create scaled mountain profiles that users can trace with their fingers. Heat-formed plastic sheets work particularly well for creating smooth elevation transitions, while corrugated cardboard provides cost-effective relief for educational maps. You’ll achieve the most realistic results by using a 1:50 vertical exaggeration ratio.
Lightweight yet rigid foam boards are perfect for crafts, displays, and school projects. The 3/16" thickness is easy to cut and handle.

Add Textured Overlays for Water Bodies
Water features gain distinction through smooth, glossy materials that contrast with surrounding land textures. Apply clear vinyl sheets or laminated surfaces over blue-printed areas to simulate water’s reflective qualities. Textured gel mediums create wave patterns for oceanic areas, while smooth acrylic paint represents calm lakes. You can enhance the effect by adding slight depressions beneath water overlays to create subtle depth variations.
Protect your desk or table with this 1.5mm clear PVC cover. It prevents scratches, spills, and stains while still showcasing your furniture's beauty, and can be easily cut to size for a custom fit.

Apply Sandpaper-Like Surfaces for Desert Areas
Desert regions communicate their harsh character through coarse, granular textures that mirror actual sand composition. Fine-grit sandpaper adheres well to map surfaces while providing authentic tactile feedback. Textured spray paints mixed with sand particles create uniform coverage across large desert areas. You’ll find that 220-grit sandpaper offers the ideal balance between tactile recognition and user comfort during extended map exploration sessions.
This 220 grit sandpaper is ideal for general purpose sanding on paint, wood, and metal. The aluminum oxide mineral ensures effective material removal for a smooth finish.

Integrate Sound Elements for Interactive Digital Maps
Sound transforms digital maps from static displays into immersive navigation experiences. Modern mapping platforms now support audio integration that guides users through complex geographical environments with precision and clarity.
Embed Audio Cues for Different Geographical Features
Geographic features generate distinct audio signatures that enhance spatial understanding. Water bodies produce gentle flowing sounds or wave crashes, while forest areas incorporate rustling leaves and bird calls. Mountain regions feature wind whistles and echo effects that communicate elevation changes. Urban zones integrate traffic noise and pedestrian activity to establish city density. These audio markers help users identify terrain types instantly without relying solely on visual interpretation, creating memorable associations between sound patterns and landscape characteristics.
Include Ambient Sounds for Environmental Context
Environmental soundscapes provide rich contextual information about map locations and weather conditions. Desert regions incorporate wind-blown sand and sparse wildlife calls, while tropical areas feature dense insect choruses and rainfall patterns. Coastal zones blend seagull cries with rhythmic wave sounds, and arctic regions use wind howls and ice cracking effects. Seasonal variations add temporal context through spring bird migrations, summer cricket symphonies, autumn wind gusts, and winter silence. These ambient layers create atmospheric depth that helps users understand climate patterns and ecological conditions.
Add Voice-Guided Navigation Instructions
Voice guidance systems deliver precise directional information through clear spoken instructions and landmark identification. Professional narrators provide turn-by-turn directions with distance measurements, street names, and notable building references. Multiple language options accommodate diverse user populations, while adjustable speech rates serve different comprehension needs. Emergency situations trigger urgent voice alerts about road closures, hazardous conditions, and alternative route suggestions. Integration with GPS systems ensures real-time accuracy, while offline voice packages maintain functionality in areas with limited connectivity.
Navigate with ease using this 7-inch GPS navigator, featuring real-time voice guidance and pre-loaded 2025 maps. Customize routes based on your vehicle type to avoid restrictions and receive speed & red light warnings.

Apply Color Psychology to Enhance Emotional Connection
Color choices in your maps create immediate psychological responses that influence how users perceive and interact with geographic information. Strategic color application transforms functional navigation tools into emotionally resonant experiences that enhance spatial understanding.
Choose Warm Colors for Populated Areas
Warm colors like oranges, reds, and yellows naturally attract attention and create feelings of energy and human activity. You’ll find these hues particularly effective for marking cities, residential zones, and commercial districts on your maps. Research shows that warm color palettes increase user engagement with urban areas by 34% compared to neutral alternatives. Apply graduated warm tones to indicate population density—lighter oranges for suburban areas transitioning to deeper reds for metropolitan centers.
Use Cool Tones for Natural Landscapes
Cool blues, greens, and purples evoke tranquility and natural environments, making them ideal for representing forests, water bodies, and protected areas. These colors align with users’ innate associations between blue and water or green and vegetation. You’ll create more intuitive navigation when cool tones represent hiking trails, national parks, and recreational waterways. Studies indicate that cool color schemes reduce cognitive load by 28% when users identify natural features on topographic maps.
Learn essential map reading and navigation skills with this U.S. Army guide. Designed for practical use, it provides clear instructions for navigating any terrain.

Implement High Contrast for Accessibility
High contrast color combinations ensure your maps remain readable for users with visual impairments or color vision deficiencies. You’ll need minimum contrast ratios of 4.5:1 between text and background colors to meet WCAG accessibility standards. Dark text on light backgrounds or bright colors against dark fields provide optimal readability. Consider using pattern fills alongside color coding—diagonal lines for urban areas or dots for agricultural zones—to convey information through multiple visual channels simultaneously.
Incorporate Scented Materials for Physical Map Installations
Physical map installations reach new dimensions when you integrate aromatic elements that correspond to geographical features. Strategic scent placement transforms static displays into immersive experiences that engage visitors’ olfactory senses alongside visual perception.
Infuse Ocean Scents Near Coastal Regions
Position salt spray and seaweed fragrances along coastlines to create authentic maritime experiences. You’ll achieve realistic coastal atmospheres by embedding marine-scented gel pods beneath transparent overlays covering beach areas. Saltwater mist dispensers activated by motion sensors enhance visitor engagement while mimicking natural ocean breezes. This technique proves particularly effective in museum installations where visitors spend extended time exploring coastal geography.
Improve reading focus and comfort with these colored overlays. This pack includes 20 sheets in 7 colors to reduce visual stress and aid readers of all ages.

Add Pine Fragrances to Forest Areas
Embed evergreen essential oils within forested sections to simulate woodland environments authentically. You can integrate pine-scented materials using microporous substrates that release fragrance gradually without overwhelming adjacent areas. Cedar and fir essences work exceptionally well when applied to raised relief features representing mountain forests. Time-release scent cartridges ensure consistent aromatic delivery throughout exhibition periods while maintaining appropriate intensity levels.
Use Floral Essences for Garden and Park Locations
Apply botanical fragrances to recreational and cultivated spaces for enhanced spatial recognition. You’ll create memorable associations by matching specific flower scents to corresponding park features—lavender for meditation gardens and rose essences for formal botanical areas. Micro-encapsulated fragrance beads embedded in map substrates provide controlled scent release when touched, allowing interactive exploration of green spaces through multiple sensory channels.
Design Temperature-Responsive Map Features
Temperature-responsive elements transform static maps into dynamic climate visualization tools. These innovative features provide immediate sensory feedback about environmental conditions through physical temperature changes.
Create Heat-Sensitive Elements for Climate Data
Heat-sensitive materials change color or texture when temperatures rise, making climate data instantly tangible. Thermochromic films shift from dark blue to bright red as ambient temperature increases, visually representing real-time weather conditions on your map surface.
You’ll need thermochromic inks rated for 80-90°F activation temperatures for indoor installations. Apply these materials to weather station locations and temperature gradient zones. The color transitions create an immediate visual connection between actual temperature readings and map data.
Implement Cool-Touch Materials for Arctic Regions
Cool-touch surfaces simulate Arctic environments through thermal conductivity properties. Copper-backed materials and aluminum substrates draw heat away from users’ fingertips, creating an instant temperature drop when touching polar regions on your map.
Mount these materials beneath transparent acrylic overlays to protect the surface while maintaining thermal transfer. Position cooling elements strategically over Greenland, Antarctica, and northern Canada to reinforce the connection between geography and climate reality through direct sensory experience.
Add Warm Surfaces for Tropical Zone Representations
Warm surfaces replicate tropical heat through embedded heating elements or solar-activated materials. Low-voltage heating pads positioned beneath equatorial regions create gentle warmth that mimics tropical climates without causing discomfort.
Solar-responsive materials offer an energy-efficient alternative, absorbing ambient light and converting it to mild heat output. Install these elements across the equatorial belt, Southeast Asia, and Central America. Set temperature controls to maintain 85-95°F surface temperatures for authentic tropical sensation.
Utilize Motion and Movement in Dynamic Map Displays
Motion transforms static geographical information into engaging visual narratives that capture users’ attention and improve spatial comprehension. You’ll create more compelling map experiences by incorporating animated elements that respond to real-world changes and user interactions.
Animate Weather Patterns and Climate Changes
Animate cloud formations using time-lapse sequences that show storm systems developing and moving across your mapped regions. You can integrate NOAA weather data feeds to display real-time precipitation patterns through animated rainfall overlays that pulse and shift with current conditions. Temperature gradients become more intuitive when you visualize them through color transitions that flow across terrain features, while wind patterns gain clarity through animated arrow streams that adjust direction and intensity based on meteorological data feeds.
Show Real-Time Traffic Flow with Moving Elements
Show traffic congestion through animated color changes that transition from green to red as road segments become more crowded throughout the day. You’ll enhance navigation accuracy by displaying moving dots or pulse effects along major highways that represent actual vehicle flow rates from traffic monitoring systems. Incorporate animated route suggestions that highlight alternative pathways when congestion builds, using flowing line animations that guide users toward faster travel options based on current traffic API data.
Display Seasonal Changes Through Morphing Landscapes
Display seasonal transitions through gradual color shifts that transform green summer foliage into autumn oranges and winter whites over time-compressed animations. You can create compelling visual narratives by morphing vegetation coverage, showing how agricultural areas change from planting to harvest seasons through texture and color evolution. Snow line animations effectively demonstrate elevation-based climate patterns, while lake and river levels can fluctuate visually to reflect seasonal water availability and drought conditions in your mapped regions.
Combine Multiple Sensory Elements for Immersive Experiences
The most compelling map experiences emerge when you strategically blend multiple sensory channels to create comprehensive spatial narratives. Professional cartographers achieve breakthrough engagement by orchestrating visual, auditory, tactile, and environmental elements into cohesive multi-dimensional experiences.
Layer Visual, Audio, and Tactile Components
You’ll create powerful spatial understanding by synchronizing visual color changes with corresponding audio cues and tactile feedback. Urban areas benefit from combining bright visual markers with city soundscapes and smooth surface textures, while rural zones pair earthy colors with nature sounds and rough tactile elements. Interactive installations achieve maximum impact when visual elevation changes trigger both audio altitude cues and physical texture variations that correspond to terrain difficulty.
Create Synesthetic Map Experiences
Your maps can trigger cross-sensory associations by deliberately connecting different sensory inputs to geographic features. Temperature-responsive materials paired with seasonal color palettes create authentic climate experiences, while ocean areas combining blue visual elements with salt scents and wave sounds establish powerful coastal associations. Forest regions achieve synesthetic depth through green visual cues, pine fragrances, and rustling leaf audio that reinforce each other’s spatial meaning.
Design Multi-Modal Navigation Systems
You’ll enhance accessibility and user engagement by building navigation systems that provide information through multiple sensory channels simultaneously. Voice directions paired with vibration patterns and visual highlighting ensure no user misses critical navigation cues. Emergency situations benefit from multi-modal alerts combining flashing colors, warning sounds, and tactile notifications that grab attention through redundant sensory pathways, creating fail-safe communication systems for critical geographic information.
Conclusion
Sensory map design represents the future of navigation and spatial understanding. By incorporating tactile textures sound cues temperature elements and aromatic features you’re creating experiences that go far beyond traditional visual representations.
These innovative approaches don’t just make maps more engaging—they make them more accessible and memorable for diverse users. Whether you’re designing for physical installations or digital platforms the integration of multiple sensory channels transforms how people interact with geographic information.
The key lies in thoughtful implementation that enhances rather than overwhelms the user experience. When you combine these sensory elements strategically you’ll create maps that truly connect with your audience on multiple levels.
Frequently Asked Questions
What are multi-sensory maps and how do they differ from traditional maps?
Multi-sensory maps incorporate tactile textures, sound cues, scent markers, and temperature-responsive elements beyond traditional visual representations. Unlike conventional maps that rely solely on visual information, these innovative designs engage all five senses to create more immersive, accessible, and memorable navigation experiences for diverse users.
How do tactile textures enhance map usability?
Tactile textures allow users to explore maps through touch by incorporating raised relief for mountains, textured overlays for water bodies, and sandpaper-like surfaces for deserts. These physical elements make maps more accessible to visually impaired users while providing intuitive terrain recognition that corresponds to real-world geographical characteristics.
What role does sound play in modern digital mapping?
Sound elements transform static maps into immersive navigation tools through audio cues like flowing water, rustling leaves, and urban traffic sounds. These auditory features enhance spatial understanding, create memorable location associations, provide contextual weather information, and support voice-guided navigation systems for improved accessibility.
How does color psychology impact map design effectiveness?
Strategic color choices create emotional connections and influence user interactions with geographic information. Warm colors like oranges and reds attract attention to populated areas, while cool blues and greens promote tranquility in natural landscapes. High contrast combinations ensure accessibility for users with visual impairments.
Can maps actually incorporate scents and smells?
Yes, physical map installations can embed scented materials to engage visitors’ olfactory senses. Ocean scents near coastal regions, pine fragrances in forest areas, and floral essences in parks create authentic atmospheric experiences that enhance spatial recognition and memory through multi-sensory engagement.
What are temperature-responsive map features?
Temperature-responsive maps use materials like thermochromic films that change color or texture with temperature variations, providing immediate climate feedback. Cool-touch materials simulate Arctic environments while warm surfaces replicate tropical conditions, making climate data tangible and creating authentic sensory experiences.
How do animated elements improve map comprehension?
Animated map elements capture attention and improve spatial understanding by displaying real-time changes like weather patterns, traffic flow, and seasonal transitions. Time-lapse sequences illustrate storm systems, while morphing landscapes show seasonal changes, transforming static information into engaging visual narratives.
Are multi-sensory maps more accessible than traditional maps?
Yes, multi-sensory maps significantly improve accessibility by accommodating diverse user needs through multiple sensory channels. They provide alternatives for visually impaired users through tactile and auditory features, while offering enhanced engagement and comprehension for all users through synchronized sensory inputs.