7 Best Map Scale Applications for Visual Impact
Maps aren’t just for navigation anymore. You can harness the power of map scales in surprising ways that’ll transform how you visualize data and solve everyday problems.
From creating immersive art installations to designing better urban spaces the applications for map scaling extend far beyond traditional cartography. These unconventional approaches unlock new possibilities for education business planning and creative expression.
Whether you’re a designer educator or entrepreneur understanding these innovative map scale techniques will give you fresh tools for your next project.
Disclosure: As an Amazon Associate, this site earns from qualifying purchases. Thank you!
P.S. check out Udemy’s GIS, Mapping & Remote Sensing courses on sale here…
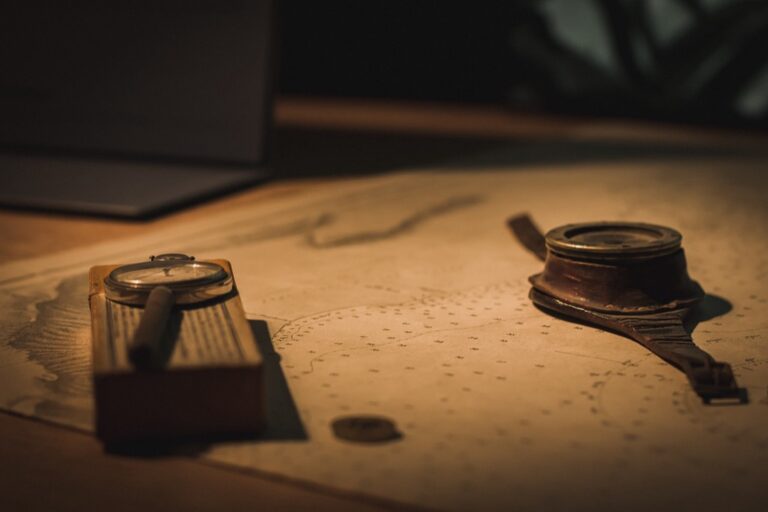
Transform Your Living Space With Giant Wall Maps at Unusual Scales
This giant, laminated world map (46 x 80 inches) makes a striking addition to any space. Updated for 2024, it features detailed political boundaries and can be written on with whiteboard markers.

Unconventional map scales revolutionize interior design by transforming ordinary walls into captivating focal points. These oversized cartographic displays create immersive environments that blend functionality with artistic expression.
Create Statement Walls Using Topographic Relief Maps
Explore the United States with this 3D raised relief map. Feel the terrain and understand topography through its tactile, vacuum-formed design.

Topographic relief maps scaled to massive proportions turn mountainous terrain into dramatic wall art. You’ll achieve striking visual impact by selecting high-contrast elevation data and printing at 1:5,000 scale or larger. Mount these maps on lightweight foam core backing to emphasize the three-dimensional contour lines. Professional cartographers recommend using LiDAR-derived digital elevation models for the most accurate relief representation, ensuring your wall installation captures every ridge and valley detail.
Design Custom Neighborhood Maps for Personal Connection
Custom neighborhood maps at 1:1,000 scale reveal intimate details of your local area that standard maps overlook. You can highlight personal landmarks like your favorite coffee shop, walking routes, or childhood home using specialized GIS software. These hyper-local maps work best when printed on canvas or metal substrates that complement your interior design aesthetic. Include property boundaries, street trees, and building footprints to create a truly personalized cartographic portrait of your community.
Install Interactive Floor Maps for Educational Spaces
Interactive floor maps at unconventional scales transform learning environments into immersive geographic experiences. You’ll need projection mapping technology or printed vinyl flooring that can withstand foot traffic while maintaining cartographic accuracy. Scale these installations between 1:500 and 1:2,000 depending on your available floor space and educational objectives. Museums and schools benefit most from these installations when they incorporate touch-sensitive elements or augmented reality features that respond to user interaction.
Update your floors easily with these peel-and-stick vinyl tiles. The waterproof, self-adhesive design is renter-friendly and simple to install on most smooth surfaces, requiring no glue or special tools.

Miniaturize Entire Continents Into Functional Desk Accessories
Moving from large-scale installations to intimate workspace solutions, you can transform geographic data into practical desk accessories that bring cartographic precision to your daily environment.
Craft Paperweights From Compressed Geographic Data
Transform elevation datasets into dense, tactile paperweights using 3D printing and weighted materials. You’ll convert digital elevation models (DEMs) into STL files, then print hollow shells that you can fill with lead shot or steel pellets for optimal weight distribution. Choose prominent landforms like the Rocky Mountains or Himalayas to create conversation pieces that showcase dramatic topographic relief. Scale ratios between 1:500,000 and 1:1,000,000 work best for capturing continental features while maintaining desktop proportions.
Create 3D art with the SCRIB3D P1 3D Pen! This easy-to-use pen features adjustable speed control and includes PLA filament, a stencil book, and project guide to get you started.

Design Coasters Featuring Scaled City Layouts
Create functional coasters by laser-etching street networks onto cork, wood, or stone materials using high-resolution vector data. You’ll need to simplify complex road hierarchies, emphasizing major arterials and distinctive neighborhood patterns while removing minor streets that won’t engrave clearly at small scales. Circular formats work exceptionally well for radial cities like Paris or Washington D.C., while square coasters suit grid-based layouts like Manhattan or Chicago. Apply water-resistant finishes to protect the etched geographic details from moisture damage.
Create Bookends Shaped Like Mountain Ranges
Design sculptural bookends by extracting elevation profiles from prominent mountain chains and converting them into manufacturable forms. You’ll work with cross-sectional data from ranges like the Alps or Andes, scaling vertical exaggeration to 3:1 or 4:1 ratios for visual impact while maintaining geographic accuracy. Cast these profiles in concrete, metal, or dense resin with weighted bases to provide adequate book support. Consider incorporating LED strips along ridgelines to highlight topographic features and create ambient desk lighting.
Control these 100ft RGB LED strip lights via Bluetooth app or remote to customize colors and brightness. Sync them to music for a dynamic party atmosphere and set timers for automatic on/off.

Revolutionize Fashion Design Through Cartographic Pattern Integration
You’ll discover how map scales can transform fashion through precise geometric integration and artistic interpretation of geographic data.
Incorporate Street Grid Patterns Into Textile Designs
Create striking fabric patterns by scaling down urban street networks to textile-appropriate dimensions. Manhattan’s grid system translates beautifully to silk scarves at 1:50,000 scale, while Barcelona’s diagonal streets create dynamic geometric prints. Convert vector street data into repeating patterns using CAD software, maintaining proportional relationships between major boulevards and side streets. Laser-cut fabric stencils from simplified grid patterns enable precise application of metallic foils or contrasting dyes across various textile weights.
Transform Contour Lines Into Elegant Jewelry Pieces
Transform elevation data into sophisticated jewelry by scaling topographic contours to wearable dimensions. Mount Everest’s contour lines create stunning pendant necklaces when scaled to 1:2,000,000, capturing the mountain’s distinctive profile in precious metals. 3D print contour models directly from USGS elevation datasets, then cast in silver or gold for precise geographic accuracy. Layer multiple contour rings on earrings or bracelets to represent different elevation zones, creating depth and visual interest through cartographic precision.
Apply Topographic Elements to Footwear Soles
Engineer shoe soles using actual topographic relief patterns scaled to enhance both aesthetics and functionality. Extract elevation profiles from hiking trail datasets and scale them to sole dimensions, creating natural grip patterns that mirror real terrain. 3D print prototype soles from LIDAR elevation data at 1:500 scale, incorporating drainage channels that follow natural watershed patterns. Test traction performance by matching sole topography to intended terrain types, ensuring both cartographic accuracy and practical performance benefits.
Engineer Architectural Models Using Inverted Scale Principles
You can revolutionize architectural visualization by applying inverted cartographic scales that flip traditional topographic relationships. This technique transforms landscape data into unexpected three-dimensional forms that challenge conventional spatial perception.
Build Skyscrapers Representing Valley Depths
You’ll create striking vertical structures by translating valley floor elevations into building heights. Extract bathymetric data from river valleys or canyon systems using LIDAR datasets, then invert the depth measurements to determine tower specifications. A 500-foot canyon depth becomes a 500-foot skyscraper in your architectural model. Position these inverted valley towers according to their geographic coordinates, maintaining accurate spatial relationships while reversing the vertical dimension completely.
Construct Underground Spaces Mirroring Mountain Heights
You can design subterranean environments that mirror peak elevations by converting mountain height data into excavation depths. Process digital elevation models through GIS software to extract summit coordinates and elevation values, then apply these measurements to underground chamber specifications. Mount McKinley’s 20,310-foot height translates into a corresponding underground space depth. Layer these inverted mountain chambers beneath your architectural site using the same footprint patterns as their surface counterparts.
Design Inverted Cityscapes for Artistic Installation
You’ll transform urban topology into captivating art installations by inverting city elevation profiles and building heights. Collect municipal GIS data showing building footprints and floor counts, then flip the vertical relationships to create sunken plaza systems. Downtown Manhattan’s tallest buildings become the deepest excavated spaces in your inverted cityscape model. Maintain street grid patterns while reversing all vertical elements, creating familiar yet disorienting spatial experiences for installation visitors.
Develop Educational Tools Through Tactile Map Scaling
Transform traditional cartographic data into interactive learning experiences that engage multiple senses and accommodate diverse learning needs.
Create Braille-Compatible Relief Maps for Accessibility
Convert elevation datasets into tactile surfaces using 3D printing techniques with exaggerated vertical scales. Set relief ratios at 1:50,000 horizontal to 1:5,000 vertical for optimal finger navigation. Apply Braille labels to key geographic features using adhesive dots positioned at consistent 15mm intervals. Test accessibility standards by consulting local organizations for the visually impaired to ensure proper texture contrast and readable elevation differences across mountain ranges, valleys, and water bodies.
Build Three-Dimensional Puzzle Maps for Geography Learning
This 70-piece world map puzzle makes geography fun for kids. Large, durable pieces with smooth edges are easy to grasp, while vibrant illustrations introduce landmarks, animals, and cultures.

Design interlocking geographic puzzles by segmenting topographic data into watershed boundaries or political divisions. Use laser-cutting to create precise wooden pieces scaled at 1:100,000 with 8mm thickness for durability. Layer different elevations using contrasting wood types – maple for lowlands and walnut for highlands. Include magnetic connectors beneath each piece to ensure proper alignment while teaching students about regional geography, climate zones, and natural boundaries through hands-on assembly.
Design Sandbox Models for Hands-On Exploration
Engineer interactive sand tables with integrated projection mapping systems that display real-time contour lines as students reshape terrain. Scale physical dimensions at 1:25,000 to accommodate classroom spaces while maintaining geographic accuracy. Install depth sensors positioned 60cm above the surface to track elevation changes and trigger corresponding topographic overlays. Use fine-grain silica sand mixed with 10% polymer binding agent to prevent excessive dust while ensuring moldable consistency for watershed modeling and erosion demonstrations.
Innovate Digital Gaming Environments With Scale Manipulation
Game developers now harness unconventional map scaling to create immersive digital experiences that challenge traditional spatial perception. These techniques transform geographic data into interactive entertainment platforms that engage players across multiple dimensional perspectives.
Generate Procedural Worlds Using Real Geographic Data
Transform USGS elevation datasets into dynamic game terrains by converting digital elevation models (DEMs) into height maps. Extract topographic data from NASA’s SRTM database and import it directly into Unity or Unreal Engine using specialized plugins like World Creator or Gaia. Scale the vertical relief by factors of 10-50x to create dramatic landscapes that maintain geographic accuracy while enhancing gameplay dynamics. Convert bathymetric ocean floor data into underground cave systems by inverting depth values, creating realistic subterranean environments. You’ll achieve authentic terrain variation that mirrors real-world geography while providing engaging exploration opportunities for players.
Create Time-Lapse Games Showing Geographic Evolution
Design gameplay mechanics that visualize geological processes by scaling time from millions of years to minutes using historical geographic datasets. Implement NOAA’s climate data to show ice age formations and retreats as interactive puzzles where players manipulate environmental factors. Utilize sediment deposition models from river systems to create city-building mechanics where terrain changes affect urban development patterns. Program erosion algorithms based on actual weathering data to demonstrate mountain formation and valley carving as strategic challenges. These temporal scaling techniques transform abstract geological concepts into engaging interactive experiences that teach earth science principles through active participation.
Design Virtual Reality Experiences at Multiple Scales
Develop VR applications that allow seamless transitions between microscopic and satellite-scale perspectives using logarithmic zoom controls. Program molecular-to-continental scaling systems where users examine soil composition at nanometer resolution then pull back to view entire watersheds. Implement haptic feedback systems that provide tactile sensations corresponding to different map scales – feeling individual grains of sand at close range or sensing mountain ranges at continental scales. Create gesture-based navigation that responds to hand movements for intuitive scale manipulation, allowing users to “grab” and resize geographic features. These multi-scale VR environments provide unprecedented spatial understanding by letting users experience geographic relationships across dimensional boundaries.
Establish Artistic Installations Through Extreme Scale Variations
You’ll discover that extreme cartographic scaling transforms ordinary geographic data into extraordinary artistic experiences that challenge viewers’ perception of space and place.
Project Microscopic Geographic Details Onto Large Surfaces
You can magnify intricate watershed networks from 1:24,000 USGS quadrangles to wall-sized installations spanning 20-30 feet. Transform creek tributaries into flowing artistic elements using laser projection mapping or vinyl wall graphics. Scale individual property boundaries from cadastral datasets into room-filling displays that reveal hidden geometric patterns. These micro-to-macro translations create immersive environments where viewers discover previously invisible geographic relationships through dramatic size amplification.
Create Gallery Exhibitions Featuring Multi-Scale Perspectives
You’ll design gallery spaces that display the same geographic area at radically different scales simultaneously. Mount a 1:1,000,000 regional overview alongside detailed 1:500 street-level sections to demonstrate scalar relationships. Create interactive displays where visitors navigate between satellite imagery at 1:50,000 and building footprints at 1:200. Position viewers within layered perspectives that reveal how cartographic scale fundamentally changes geographic understanding and spatial awareness.
Design Public Art Using Community-Specific Geographic Elements
You can extract elevation contours from local DEMs and translate them into sculptural installations that celebrate neighborhood topography. Transform utility infrastructure maps into artistic pathways using community utility datasets scaled to pedestrian experiences. Create memorial walls featuring historic property boundaries at enlarged scales that honor local development patterns. These installations connect residents to their geographic heritage while demonstrating how extreme scaling reveals the artistic potential within mundane municipal datasets.
Conclusion
You’ve discovered how map scales can transcend traditional boundaries and create remarkable opportunities across multiple industries. From fashion accessories that showcase urban grids to interactive educational tools that make geography tangible these applications demonstrate the untapped potential hiding within cartographic data.
Your next project could benefit from incorporating these innovative scaling techniques whether you’re designing spaces creating art or developing educational programs. The key lies in viewing geographic information not just as navigation tools but as creative raw materials waiting to be transformed.
Consider experimenting with one of these approaches in your upcoming work. You’ll find that unconventional map scaling opens doors to unique solutions while connecting people to their environments in meaningful and unexpected ways.
Frequently Asked Questions
What are unconventional map scales and how do they differ from traditional maps?
Unconventional map scales go beyond standard navigation purposes, transforming geographic data into creative applications across various fields. Unlike traditional maps that focus on wayfinding, these innovative approaches use cartographic information for interior design, fashion, architecture, education, gaming, and art installations. They manipulate scale, perspective, and presentation to create immersive experiences and solve problems in unexpected ways.
How can maps be used in interior design and home decoration?
Maps can transform interior spaces through oversized cartographic displays, topographic relief maps, and custom neighborhood artwork. Interactive floor maps using projection mapping or printed vinyl create immersive educational environments. Additionally, miniaturized geographic data can be converted into functional desk accessories like 3D-printed paperweights from elevation data, laser-etched coasters featuring city layouts, and sculptural bookends shaped like mountain ranges.
What role do maps play in modern fashion design?
Maps are revolutionizing fashion through cartographic patterns integrated into textiles. Designers create fabric patterns from urban street grids, such as Manhattan’s layout for silk scarves. Topographic contour lines inspire elegant jewelry pieces like Mount Everest-inspired pendant necklaces. Shoe designers engineer soles using topographic relief patterns, combining aesthetic appeal with practical performance benefits for various creative industries.
How are architects using inverted cartographic scales in building design?
Architects employ inverted cartographic scales to challenge conventional spatial perception. They create skyscrapers representing valley depths by translating bathymetric data into building heights, and design underground spaces mirroring mountain heights by converting peak elevations into excavation depths. This approach also enables inverted cityscapes for artistic installations, transforming urban topology into captivating art through flipped vertical relationships.
What educational benefits do tactile map scaling techniques offer?
Tactile map scaling creates interactive learning experiences that engage multiple senses and accommodate diverse learning needs. These techniques include Braille-compatible relief maps using 3D printing for accessibility, three-dimensional puzzle maps teaching geography through hands-on assembly, and interactive sand tables allowing students to reshape terrain while visualizing contour lines. These methods enhance geographic education through innovative, multisensory approaches.
How are game developers incorporating unconventional map scaling into digital experiences?
Game developers utilize unconventional map scaling to create immersive digital experiences that challenge traditional spatial perception. They transform USGS elevation datasets into dynamic game terrains and convert bathymetric data into realistic subterranean environments. Time-lapse games visualize geological processes, while virtual reality applications allow seamless transitions between different scales, enhancing spatial understanding through interactive gaming experiences.
What artistic opportunities does extreme cartographic scaling provide?
Extreme cartographic scaling transforms ordinary geographic data into extraordinary artistic experiences. Artists project microscopic geographic details onto large surfaces, magnifying intricate watershed networks into wall-sized installations. Gallery exhibitions display the same geographic area at radically different scales simultaneously. Public art incorporates community-specific geographic elements, creating sculptural installations celebrating local topography and memorial walls honoring historic boundaries.