7 Best Digital Map Accessibility Features
Creating accessible maps isn’t just good practice—it’s essential for reaching millions of users with disabilities who rely on digital navigation tools daily. Your mapping applications need to work seamlessly for people using screen readers, those with limited mobility, and users with various visual impairments.
Read comfortably with this lightweight, full-page 5X magnifying glass. Its large viewing area and ergonomic handle make it ideal for seniors and those with low vision to easily read small print.

The bottom line: Seven key accessibility principles can transform your maps from barriers into bridges, ensuring everyone can navigate your digital world with confidence.
Disclosure: As an Amazon Associate, this site earns from qualifying purchases. Thank you!
Provide Alternative Text for Map Images and Visual Elements
Screen readers can’t interpret visual map content without proper text alternatives. You’ll need to create meaningful descriptions that convey the same information your visual elements communicate to sighted users.
P.S. check out Udemy’s GIS, Mapping & Remote Sensing courses on sale here…
Write Descriptive Alt Text for Static Map Images
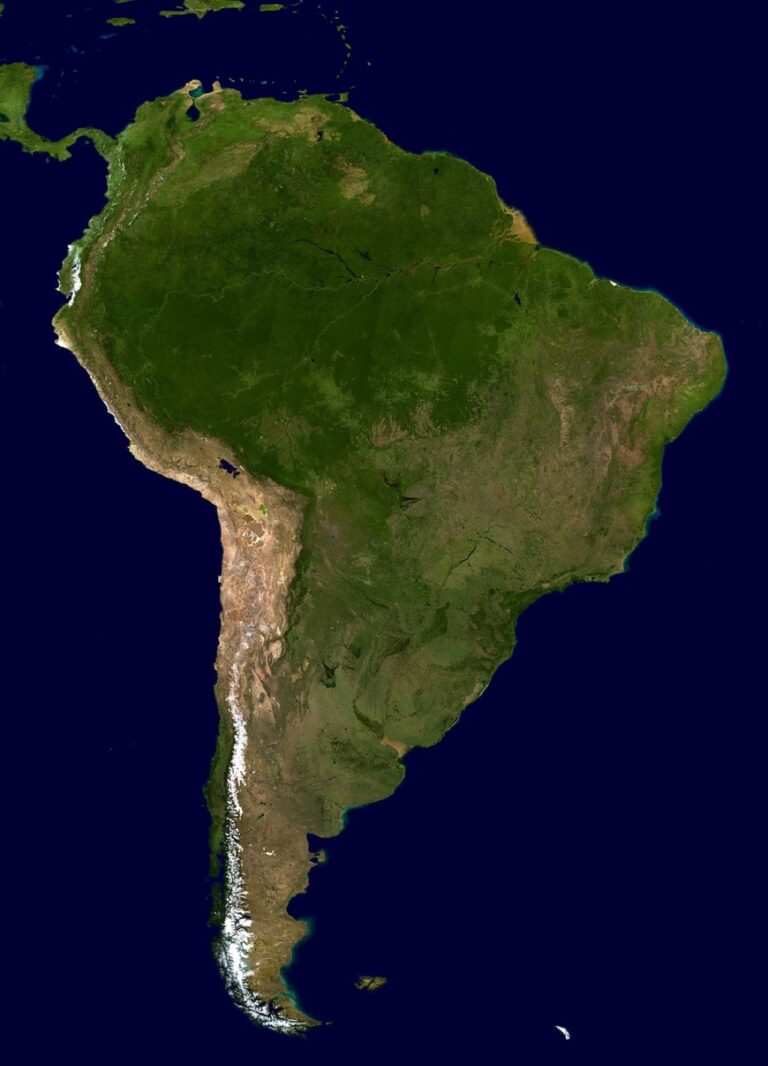
Focus on essential geographic information when writing alt text for static maps. Include the map’s geographic scope, key features, and data being displayed rather than describing visual styling.
For a population density map of California, write “Population density map of California showing highest concentrations in Los Angeles, San Francisco Bay Area, and San Diego regions” instead of “Colorful map with red and orange areas.” Include specific data ranges when relevant: “Temperature map showing 75-85°F range across southeastern United States.”
Include Context and Purpose in Alternative Descriptions
Explain why the map exists and what users should understand from it. Your alternative text should answer the question “What story does this map tell?”
Connect the map’s purpose to user needs in your descriptions. For a hiking trail map, write “Trail network map of Yellowstone National Park showing 15 marked hiking routes with difficulty levels and estimated completion times.” Include relevant warnings or important context: “Flood risk map indicating high-risk zones along Mississippi River requiring evacuation planning.
Create Text Alternatives for Interactive Map Features
Describe interactive elements and their functions clearly for users relying on assistive technology. Include information about clickable areas, zoom levels, and available layer options.
Structure descriptions to match user interaction patterns. For a transit map, write “Interactive subway map with clickable station markers providing service alerts and arrival times. Use arrow keys to navigate between 47 stations across 6 color-coded lines.” Include keyboard navigation instructions and describe any hover states or tooltip information that appears with mouse interaction.
Ensure Keyboard Navigation Support for Interactive Maps
Keyboard navigation transforms maps from visual-only interfaces into accessible tools that users can explore without a mouse. Your interactive mapping application must support standard keyboard interactions to meet accessibility standards and serve users with motor disabilities.
Implement Tab Order for Map Controls and Features
Establish a logical tab sequence that follows the visual hierarchy of your map interface. Start with primary navigation controls like zoom buttons and search fields, then move to secondary features such as layer toggles and legend items. Configure tab stops for all interactive elements including markers, popups, and control panels. Use the tabindex attribute to create a predictable flow that matches user expectations, ensuring users can access every clickable element without getting trapped in complex interface components.
Enable Arrow Key Navigation for Map Panning
Configure arrow keys to pan your map in 10-20 pixel increments for precise navigation control. Implement smooth panning that moves the map viewport without jarring jumps or excessive speed changes. Add modifier keys like Shift+Arrow for larger pan distances and Ctrl+Arrow for smaller precision movements. Test your arrow key implementation with screen readers to ensure the panning actions don’t interfere with assistive technology navigation, and provide audio feedback when users reach map boundaries or encounter significant geographic features.
Provide Keyboard Shortcuts for Common Map Functions
Assign intuitive keyboard shortcuts for essential mapping functions like zoom in (+ key), zoom out (- key), and return to default view (Home key). Create shortcuts for layer switching, search activation, and marker selection using common conventions like Ctrl+F for find and Escape for closing dialogs. Document your keyboard shortcuts in an accessible help section and consider implementing a shortcut overlay that appears when users press the question mark key. Ensure shortcuts work consistently across different browsers and don’t conflict with standard browser or screen reader commands.
Design High Contrast Visual Elements for Better Visibility
Visual accessibility in mapping requires deliberate design choices that support users with various vision conditions. High contrast elements ensure your maps remain functional across different viewing environments and accessibility needs.
Use Sufficient Color Contrast Ratios for Map Layers
Map elements need minimum 3:1 contrast ratios against backgrounds to meet WCAG AA standards. Test your color combinations using tools like WebAIM’s Contrast Checker before finalizing your palette. Dark blue water features against light gray backgrounds provide excellent contrast, while yellow roads on white backgrounds often fail accessibility requirements. Consider using darker stroke weights around lighter colored polygons to boost contrast ratios. Tools like ColorBrewer 2.0 offer pre-tested color schemes that maintain accessibility standards across different map layer combinations.
Implement Pattern and Texture Alternatives to Color Coding
Hatching patterns and texture fills provide essential visual alternatives when color alone carries meaning. Use diagonal lines for industrial zones, dots for residential areas, and crosshatching for mixed-use districts instead of relying solely on color differentiation. ArcGIS Pro and QGIS offer extensive pattern libraries that maintain clarity at various zoom levels. Combine fill patterns with distinct outline styles to create additional visual separation. Consider using different line weights, dash patterns, or symbol shapes to distinguish between similar feature types like hiking trails versus bike paths.
Test Map Visibility in High Contrast Mode
Windows High Contrast Mode and similar accessibility features dramatically alter map appearance and functionality. Enable these modes during your design process to identify elements that disappear or become unreadable. Custom CSS media queries can detect high contrast mode and adjust your web map styling accordingly. Test interactive elements like buttons and zoom controls to ensure they remain visible and functional. Many vector symbols and custom icons require alternative high contrast versions to maintain usability across different accessibility settings.
Implement Screen Reader Compatibility Features
Screen reader compatibility transforms your maps from visual-only tools into accessible navigation aids. Proper implementation ensures users with visual impairments can access your mapping content effectively.
Structure Map Data with Proper HTML Semantics
Organize your map elements using semantic HTML landmarks and ARIA roles. Apply <nav> tags for map controls, <main> for the primary map container, and role="application" for interactive mapping widgets. Structure layer controls with <fieldset> and <legend> elements to group related map functions. Use proper heading hierarchy (h1-h6) for map sections and ensure all interactive elements have descriptive aria-label attributes that screen readers can interpret accurately.
Provide Accessible Labels for Map Regions and Points
Label every interactive map feature with descriptive text that conveys location and purpose. Use aria-label attributes for point markers that include both the feature name and its geographic context, such as “City Hall, Downtown Seattle” or “Emergency Exit, Building A Second Floor.” Implement aria-describedby for complex features that need additional context. Create region labels using aria-labelledby to connect map areas with their corresponding text descriptions, ensuring screen readers announce both the feature type and its specific location details.
Create Audio Descriptions for Complex Geographic Information
Develop comprehensive audio descriptions that explain spatial relationships and geographic patterns. Record descriptions for complex map visualizations like population density heat maps, elevation contours, or traffic flow patterns. Include directional information such as “high density areas extend northeast from the city center” and comparative data like “the northern region shows 40% higher values than the southern area.” Provide audio cues for map interactions, including zoom level changes and layer transitions, helping users understand their current view and navigation options.
Optimize Map Loading and Performance for Assistive Technologies
Assistive technologies require optimized map performance to function effectively, as screen readers and other accessibility tools process map data differently than standard browsers. Poor loading times can cause these technologies to timeout or fail entirely.
Minimize Map Loading Times and Reduce Data Overhead
Optimize your map’s initial load by implementing tile-based rendering and lazy loading for non-essential features. Compress vector data using formats like PBF (Protocol Buffer Format) and enable GZIP compression on your server. Prioritize critical map elements like base layers and navigation controls to load first, while deferring decorative elements. Use content delivery networks (CDNs) to reduce latency for users accessing maps globally. Set image compression to 70-80% quality for raster tiles to balance visual clarity with file size.
Implement Progressive Enhancement for Map Features
Build your maps with a core functionality-first approach that works without JavaScript before adding interactive enhancements. Start with a static map image that includes essential location information and navigation instructions in HTML text. Layer interactive features like zoom controls and clickable markers on top of this foundation. Provide fallback text descriptions for complex visualizations and ensure all interactive elements have keyboard equivalents. Use feature detection to load advanced mapping libraries only when supported by the user’s browser and assistive technology.
Achieve a flawless, even complexion with e.l.f. Flawless Satin Foundation. This lightweight, vegan formula provides medium coverage and a semi-matte finish for all-day wear, while hydrating your skin with glycerin.

Provide Lightweight Alternatives for Complex Interactive Maps
Create simplified map versions that maintain core functionality while reducing processing demands on assistive technologies. Offer text-based location lists as alternatives to visual clustering features and provide address lookup forms instead of complex pan-and-zoom interfaces. Implement toggle switches that allow users to disable resource-intensive animations and visual effects. Design mobile-first map layouts that work effectively on slower devices and limited bandwidth connections. Include downloadable static map images with comprehensive alt text for users who need offline access.
Include Clear Map Legends and Instructional Content
Clear legends and comprehensive instructional content transform complex maps into accessible navigation tools for all users. These elements serve as crucial bridges between visual information and user understanding.
Design Accessible Legend Symbols and Labels
Design legend symbols with high contrast ratios and pair them with descriptive text labels to ensure screen reader compatibility. You’ll want to use simple geometric shapes like circles, squares, and triangles rather than complex icons that lose meaning when rendered at small sizes. Implement pattern fills alongside color coding—diagonal lines for residential areas, dots for commercial zones, and crosshatching for industrial districts. Test your legend symbols at various zoom levels to maintain clarity across different viewing conditions.
Provide Step-by-Step Navigation Instructions
Provide clear navigation instructions that guide users through map interactions without relying solely on visual cues. You’ll need to include keyboard shortcuts for common functions like zooming (+ and – keys), panning (arrow keys), and accessing layers (number keys 1-9). Create sequential instructions such as “Press Tab to navigate between map controls, then use Enter to activate selected features.” Document touch gestures for mobile users, specifying actions like “pinch to zoom” and “two-finger tap for menu access.”
Create Help Documentation for Map Usage
Create comprehensive help documentation that addresses common user scenarios and accessibility features within your mapping interface. You’ll want to organize documentation by user type—beginners need basic navigation guides while advanced users require feature-specific instructions. Include troubleshooting sections for assistive technology compatibility, screen reader settings, and high contrast mode functionality. Provide video tutorials with closed captions and audio descriptions alongside written documentation to accommodate different learning preferences and accessibility needs.
Test Map Accessibility Across Multiple Devices and Tools
You’ll need comprehensive testing across different platforms and assistive technologies to ensure your map works for all users. Real-world validation reveals accessibility gaps that automated tools often miss.
Validate Maps with Screen Reader Software
Test your maps using NVDA, JAWS, and VoiceOver screen readers to verify proper announcement of map elements. Navigate through your map using only keyboard commands while the screen reader is active. Listen for clear descriptions of geographic features, zoom levels, and interactive controls. You’ll want to ensure your ARIA labels and semantic markup translate into meaningful audio feedback. Check that complex geographic relationships are communicated effectively through your alternative text descriptions. Test both desktop and mobile screen reader versions since they handle map interactions differently.
Test Touch Navigation on Mobile Devices
Verify your map’s touch accessibility using iOS VoiceOver and Android TalkBack on actual devices. Test pinch-to-zoom functionality with assistive touch enabled and ensure double-tap gestures work consistently. Navigate through map points using swipe gestures while screen readers are active. You’ll need to confirm that touch targets meet the minimum 44px size requirement for accessibility compliance. Test your map’s responsiveness during orientation changes and verify that touch interactions don’t conflict with assistive technology gestures. Validate that custom map controls remain accessible when users enable high contrast or large text settings.
See your shots instantly with these 12x12" splatter targets. The bright fluorescent yellow impact mark is easily visible, making them ideal for all firearms, indoors or outdoors.

Conduct User Testing with People Who Have Disabilities
Recruit participants with various disabilities including visual impairments, motor limitations, and cognitive differences to test your mapping interface. Observe how real users interact with your map using their preferred assistive technologies and navigation methods. Document specific pain points where users struggle with map controls or geographic information comprehension. You’ll gain insights that technical testing can’t provide about actual user workflows and preferences. Conduct testing sessions in both controlled environments and real-world scenarios where users would typically use your mapping application. Iterate your design based on direct feedback about navigation efficiency and information accessibility.
Conclusion
Accessible mapping isn’t just good practice—it’s essential for creating truly inclusive digital experiences. When you implement these seven accessibility considerations you’re not just checking compliance boxes; you’re opening doors for millions of users who rely on assistive technologies to navigate our digital world.
Remember that accessibility improvements often benefit everyone. High contrast visuals help users in bright sunlight and clear navigation instructions make your maps easier for all users to understand and use effectively.
The investment you make in accessible mapping pays dividends through improved user experience broader audience reach and stronger SEO performance. Start with one or two considerations and gradually implement the rest—every step toward accessibility makes your maps more valuable and usable for your entire audience.
Frequently Asked Questions
What makes a map accessible to users with disabilities?
An accessible map includes alternative text for visual elements, keyboard navigation support, high contrast design, screen reader compatibility, and proper HTML semantics. It should work with assistive technologies like screen readers and provide multiple ways to access information, ensuring users with various disabilities can navigate confidently.
How do I write effective alt text for maps?
Focus on essential geographic information and context rather than describing every visual detail. Include the map’s purpose, key locations, and the story it tells. For interactive maps, describe clickable elements and navigation instructions. Keep descriptions concise but informative enough for screen readers to convey meaning.
Why is keyboard navigation important for interactive maps?
Keyboard navigation allows users with motor disabilities or those who cannot use a mouse to explore maps effectively. It provides an alternative input method through tab order navigation, arrow key panning, and keyboard shortcuts for common functions, making maps accessible to a broader range of users.
What color contrast ratios should I use for map accessibility?
Use a minimum 3:1 contrast ratio to meet WCAG AA standards for map layers and visual elements. Test color combinations using tools like WebAIM’s Contrast Checker or ColorBrewer 2.0. Additionally, implement patterns and textures alongside color coding to provide visual differentiation for users with color vision deficiencies.
How can I make maps compatible with screen readers?
Structure map data with proper HTML semantics, use ARIA roles and landmarks, and provide accessible labels with aria-label attributes. Create audio descriptions for complex geographic information and ensure all interactive elements are properly labeled. Test with popular screen readers like NVDA, JAWS, and VoiceOver.
What performance optimizations help assistive technologies?
Minimize loading times through tile-based rendering, lazy loading, and data compression. Use a core functionality-first approach where maps work without JavaScript before adding interactive features. Provide lightweight alternatives for complex maps, such as simplified versions and text-based location lists.
How should I test my maps for accessibility?
Test across multiple devices and assistive technologies including screen readers (NVDA, JAWS, VoiceOver) and mobile accessibility features (iOS VoiceOver, Android TalkBack). Conduct user testing with individuals who have disabilities to gather real-world feedback and identify pain points for iterative improvements.
What should I include in map legends and instructions?
Design legend symbols with high contrast and descriptive text labels using simple geometric shapes. Implement pattern fills alongside color coding. Provide step-by-step navigation instructions covering keyboard shortcuts and touch gestures. Create comprehensive help documentation with video tutorials featuring closed captions and audio descriptions.