5 Examples of Bias in Historical Cartography That Shaped History
Maps tell stories—but they’re not always true ones. Throughout history cartographers have embedded their cultural biases political agendas and worldviews directly into the maps we’ve relied on for centuries. These seemingly objective documents reveal how power perspective and prejudice shaped our understanding of the world in ways that still influence us today.
Explore and map the wilderness for the Queen in Cartographers! Draw unique terrain shapes and score points based on randomly selected goals each game, but beware of monster ambushes.

Disclosure: As an Amazon Associate, this site earns from qualifying purchases. Thank you!
The Mercator Projection: Distorting Size and Power
You’ll find that the Mercator projection, developed by Gerardus Mercator in 1569, became the world’s most widely used map projection despite its significant distortions. This cylindrical projection preserves angles and shapes perfectly, making it invaluable for navigation, but it dramatically exaggerates landmasses near the poles while shrinking equatorial regions.
European Superiority Through Visual Dominance
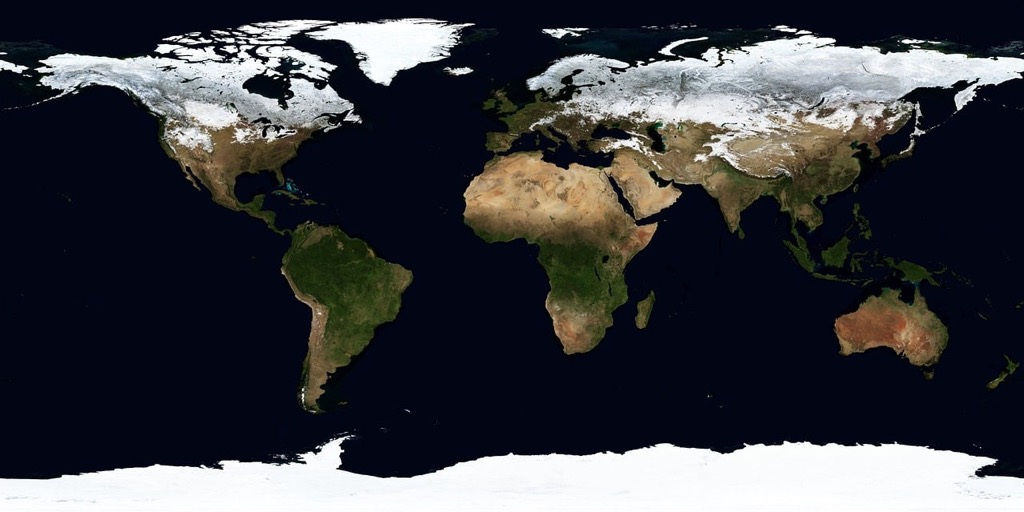
You’re seeing Europe appear disproportionately large compared to tropical regions in Mercator maps. Greenland looks three times larger than Africa, when Africa is actually 14 times bigger. This visual dominance reinforced European colonial powers’ sense of geographical importance and cultural superiority. Your eye naturally gravitates toward the oversized northern territories, making them appear more significant than equatorial nations that were actually larger and more populous.
P.S. check out Udemy’s GIS, Mapping & Remote Sensing courses on sale here…
Minimizing Africa and South America’s True Scale
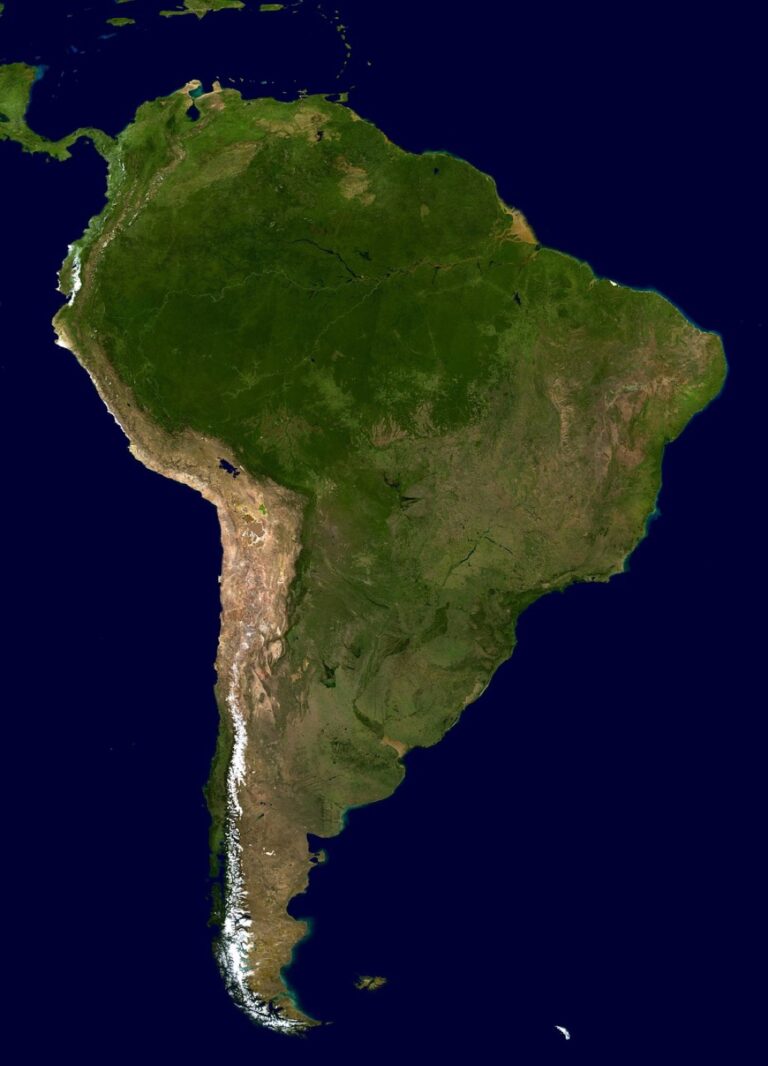
You’ll notice that Africa appears roughly the same size as North America on Mercator maps, but Africa is actually three times larger. South America looks smaller than Europe, when it’s nearly twice the size. These distortions made colonized continents appear less significant than their true massive scale. Your perception of global geography becomes skewed when you don’t realize that Africa alone can contain the United States, China, India, and most of Europe combined.
Colonial Maps: Erasing Indigenous Presence
Colonial cartographers systematically removed or minimized Indigenous communities from their maps, creating false narratives that justified territorial expansion and resource extraction.
Terra Nullius and the Myth of Empty Land
You’ll find that colonial maps deliberately depicted inhabited territories as empty wilderness, supporting the legal doctrine of terra nullius. European cartographers omitted Indigenous settlements, agricultural systems, and territorial boundaries from their maps of Australia, North America, and Africa. These blank spaces suggested unoccupied land available for colonization, despite thriving Indigenous civilizations with complex social structures and land management practices spanning thousands of years.
Renaming Places to Assert Ownership
Colonial maps replaced Indigenous place names with European designations, erasing cultural connections and historical significance from the landscape. You can see this pattern where Mount McKinley replaced Denali, and countless rivers, mountains, and regions received names honoring European explorers or monarchs. This systematic renaming process served as a cartographic tool of cultural dominance, severing Indigenous peoples’ linguistic and spiritual relationships with their ancestral territories while legitimizing colonial claims.
Eurocentric World Maps: Placing Europe at the Center
Get durable, tear-resistant posters made in the USA. Each 18" x 29" poster features high-quality 3 MIL lamination for lasting protection.

European cartographers have consistently positioned their continent at the world’s center, creating maps that reinforce cultural superiority and distort global perspectives.
The T-O Maps of Medieval Christianity
Medieval European mapmakers created T-O maps that placed Jerusalem at the world’s center with Europe prominently positioned in the lower right quadrant. These circular maps divided the world into three continents – Asia, Europe, and Africa – with Europe receiving disproportionate visual emphasis despite its smaller actual size. The Mediterranean Sea formed the vertical line of the “T” while the Don and Nile rivers created the horizontal bar, ensuring Europe’s prominent placement. This cartographic tradition established a precedent for European-centered worldviews that persisted for centuries.
Modern Perpetuation of European Centrality
Contemporary world maps continue to center Europe through the Greenwich Prime Meridian, splitting the Pacific Ocean and placing Europe in the map’s central position. Standard classroom wall maps and atlases maintain this Eurocentric perspective, reinforcing the visual dominance of European nations. Digital mapping platforms like Google Maps default to European-centered projections when displaying global views. This persistent centering affects how you perceive global relationships, making Europe appear more connected and central to world affairs than geographic reality suggests.
Orientalist Cartography: Depicting the “Exotic” East
European cartographers consistently portrayed Asia through romanticized imagery that emphasized difference rather than accuracy. These maps reflected cultural fantasies more than geographic realities.
Romanticizing and Stereotyping Asian Territories
You’ll find that 18th and 19th-century European maps depicted Asia with ornate illustrations of tigers, elephants, and turbaned figures rather than accurate topographical features. French cartographer Nicolas Sanson’s 1650 maps of India included elaborate drawings of exotic animals and mythical creatures that reinforced European perceptions of Asian lands as mysterious and primitive. These decorative elements consumed valuable map space while reducing the inclusion of actual cities, trade routes, and political boundaries. British East India Company maps frequently portrayed Indian territories through symbols of wealth like jewels and spices rather than documenting the sophisticated urban centers and agricultural systems that actually existed.
Political Motivations Behind Cultural Representations
You can trace how orientalist cartography served imperial expansion by justifying European intervention in “backward” Asian societies. Dutch maps of Southeast Asia emphasized chaos and disorder through imagery of warfare and primitive housing while minimizing depictions of established kingdoms and trade networks. The 1885 Royal Geographical Society maps of China portrayed the country as fragmented and ungovernable, supporting British arguments for increased colonial influence during the Opium Wars. These cartographic choices weren’t accidental – they created visual narratives that made European colonization appear as civilization bringing order to exotic chaos rather than the economic exploitation it actually represented.
Explore Canada's Indigenous history and culture with this comprehensive atlas. It features detailed maps and information about First Nations, Inuit, and Métis communities.
Cold War Propaganda Maps: Shaping Geopolitical Narratives
Cold War cartography transformed maps into powerful weapons of ideological warfare. You’ll discover how both superpowers manipulated geographic representations to advance their political narratives and justify military interventions worldwide.
The Red Menace Visualized Through Cartography
Red-colored territories dominated Western propaganda maps, creating visual fear through aggressive color schemes that portrayed communist expansion as an unstoppable threat. You can observe how American cartographers used deep crimson and black shading to represent Soviet-controlled areas, making them appear larger and more menacing than neutral beige or green territories.
Statistical manipulation amplified the perceived threat, with maps showing exaggerated nuclear missile ranges and inflated military base counts. Western publications routinely displayed Soviet submarine patrol areas covering vast ocean expanses, suggesting complete maritime dominance despite actual operational limitations.
Western Allies Versus Communist Bloc Representation
Democratic nations appeared prominently in blue and white, positioned centrally on Western maps to suggest moral leadership and global influence. You’ll notice how NATO countries received detailed labeling and clear territorial boundaries, while communist states often appeared as monolithic red blocks without internal distinction.
Communist cartographers reversed these visual hierarchies, placing Moscow at world map centers and using golden yellows for socialist republics. Soviet atlases minimized Western Europe’s size while emphasizing Asia and Africa as liberation zones, creating entirely different geopolitical perspectives through projection choices and scale manipulations.
Conclusion
Understanding these historical biases transforms how you’ll view any map going forward. Every cartographic choice—from projection methods to color schemes—carries the mapmaker’s perspective and agenda.
These examples reveal that maps have never been neutral documents. They’ve consistently served as instruments of power that shaped public opinion and justified political actions throughout history.
As you encounter maps today you can now recognize the subtle ways they might influence your worldview. Question what’s emphasized what’s minimized and whose perspective the map represents.
Your awareness of cartographic bias empowers you to seek multiple geographic perspectives and think critically about the visual information presented to you.
Frequently Asked Questions
What are cartographic biases and how do they affect maps?
Cartographic biases are cultural, political, and ideological influences that shape how maps are created and what they emphasize. These biases affect our understanding of geography by distorting sizes, centering certain regions, and omitting or misrepresenting others. Maps are not objective representations but reflect the worldviews and agendas of their creators, influencing how we perceive global relationships and power dynamics.
How does the Mercator projection distort our view of the world?
The Mercator projection, developed in 1569, preserves angles and shapes for navigation but severely distorts landmass sizes. It exaggerates areas near the poles, making Europe and Greenland appear disproportionately large while minimizing equatorial regions. Africa appears smaller than it actually is (it’s three times larger than North America), and South America looks smaller than Europe despite being nearly twice its size.
What was terra nullius and how did it impact colonial mapping?
Terra nullius was a legal doctrine meaning “empty land” that colonial powers used to justify territorial expansion. Colonial maps systematically omitted Indigenous settlements, agricultural systems, and communities, depicting inhabited territories as uninhabited wilderness. This cartographic erasure suggested lands were available for colonization, despite thriving Indigenous civilizations already existing there, particularly in Australia, North America, and Africa.
Why are most world maps Eurocentric?
European cartographers historically positioned their continent at the center of maps, reinforcing cultural superiority and establishing European-centered worldviews. This tradition began with Medieval T-O maps that emphasized Europe despite its smaller size and continues today through the Greenwich Prime Meridian system. Even modern digital platforms like Google Maps default to these Eurocentric projections, perpetuating Europe’s visual dominance.
How were maps used as propaganda during the Cold War?
Both superpowers used maps as ideological weapons during the Cold War. Western maps employed aggressive red color schemes to visualize communist threats, exaggerating Soviet-controlled areas and inflating military capabilities. Soviet cartographers countered by centering Moscow on their maps, minimizing Western Europe’s size, and portraying Asia and Africa as liberation zones. These cartographic strategies shaped public perception and justified political agendas.
What is Orientalist cartography?
Orientalist cartography refers to 18th and 19th-century European maps of Asia that romanticized and stereotyped the region. These maps featured ornate illustrations of exotic animals and mythical figures while downplaying accurate topographical details and established urban centers. They served political motivations by portraying Asian societies as chaotic and in need of European intervention, justifying imperial expansion as a civilizing mission.