7 Best Map Color Palettes for Data Visualization
Why it matters: Color palettes make or break your map’s visual impact and readability. Whether you’re designing data visualizations or creating geographic presentations the right color scheme transforms raw information into compelling stories that audiences actually understand.
The big picture: From accessibility-friendly combinations to bold artistic statements these seven diverse palette approaches will elevate your cartographic work beyond basic default settings. Each strategy serves different purposes while ensuring your maps communicate effectively across various contexts and audiences.
Disclosure: As an Amazon Associate, this site earns from qualifying purchases. Thank you!
Understanding the Impact of Color on Map Design
Color choices directly influence how viewers interpret spatial information and navigate through your cartographic data. When you select inappropriate color combinations, you create cognitive barriers that prevent users from extracting meaningful insights from your visualizations. Professional mapping workflows require systematic color evaluation to ensure accessibility compliance and data accuracy representation.
P.S. check out Udemy’s GIS, Mapping & Remote Sensing courses on sale here…
Sequential color schemes work best for displaying continuous data ranges like elevation or population density. You’ll achieve optimal results using single-hue progressions that move from light to dark values, allowing viewers to quickly identify patterns and gradients. ColorBrewer 2.0 provides scientifically-tested sequential palettes that maintain perceptual uniformity across different output devices.
Diverging palettes effectively highlight deviations from central values in your datasets. You can emphasize areas above and below critical thresholds using contrasting hues that meet at a neutral midpoint. This approach proves particularly valuable when mapping temperature anomalies, election results, or demographic changes where directional differences matter more than absolute values.
Monochromatic Elegance: Creating Depth with Single Hue Variations
Monochromatic color schemes offer sophisticated visual hierarchy while maintaining design consistency across your cartographic projects. You’ll create stunning map aesthetics using variations of a single hue through strategic lightness and saturation adjustments.
Choosing Your Base Color
Select your primary hue based on your map’s intended message and data characteristics. Blue works exceptionally well for water features, population density, and temperature data due to its natural associations and high readability. Green excels for vegetation indices, environmental data, and topographic elevation mapping. Red effectively communicates urgency in hazard maps, election results, and critical infrastructure data. Purple and orange provide unique alternatives for demographic studies and economic indicators where you need to avoid common color associations that might bias interpretation.
Enjoy refreshing water with the Avalon Bottom Loading Water Cooler. It offers hot, cold, and room temperature options, a BioGuard anti-microbial coating, and a child safety lock for peace of mind.

Building Tonal Hierarchy
Establish clear visual relationships using systematic lightness progression across your data ranges. Start with your base color at medium saturation, then create lighter tints by adding white for lower values and darker shades by reducing brightness for higher values. Maintain consistent saturation levels while varying lightness to preserve color harmony. Use 20-30% lightness intervals between adjacent classes to ensure adequate contrast for screen and print viewing. Test your tonal progression using grayscale conversion to verify that hierarchy remains clear for colorblind users and monochrome reproduction.
Best Use Cases for Monochromatic Maps
Deploy monochromatic schemes for choropleth maps displaying single-variable continuous data like population density, income levels, or precipitation amounts. These palettes excel in academic publications, government reports, and professional presentations where visual sophistication matters. Elevation maps benefit tremendously from monochromatic brown or green schemes that create intuitive topographic understanding. Economic data visualization using single-hue progressions eliminates potential political or cultural color biases. Monochromatic approaches work particularly well for large-scale statistical mapping where you need to maintain reader focus on data patterns rather than decorative elements.
Earth Tones: Natural Palettes for Geographic Authenticity
Earth tone palettes draw from nature’s inherent color relationships to create maps that feel organic and intuitive to viewers. These natural color schemes leverage the visual familiarity of landscape colors to enhance geographic storytelling.
Incorporating Browns and Greens
Browns anchor your earth tone palette by representing terrestrial features like mountains, deserts, and urban areas. Use rich sienna (#A0522D) for elevated terrain and lighter tan (#D2B48C) for lowlands. Greens complement browns naturally through forest coverage, agricultural zones, and vegetation density mapping. Olive green (#808000) works well for mixed landscapes, while sage green (#9CAF88) suits arid vegetation regions effectively.
Adding Warm Accent Colors
Warm accent colors energize earth tone palettes without disrupting their natural harmony. Terracotta (#E2725B) highlights important features like major cities or transportation hubs effectively. Burnt orange (#CC5500) creates visual hierarchy for secondary data layers like population density or economic indicators. Use cream (#F5F5DC) as a neutral background that allows other earth tones to stand out prominently.
Ideal Applications for Earth-Based Maps
Earth tone palettes excel in topographic mapping where natural color relationships enhance terrain interpretation and elevation understanding. Environmental studies benefit significantly from these palettes when displaying forest coverage, soil types, or land use classifications. Historical maps achieve authentic presentation using earth tones that reflect period-appropriate cartographic traditions and enhance narrative storytelling through familiar color associations.
Plan your next adventure with the 2025 National Geographic Road Atlas, covering the United States, Canada, and Mexico. Its durable, folded format (11 x 15 in) makes it ideal for hiking and camping trips.

Bold and Vibrant: High-Contrast Palettes for Modern Appeal
High-contrast palettes create striking visual impact that demands attention while maintaining clear data distinction. These dynamic color schemes excel in digital environments where screen brightness enhances their effectiveness.
Selecting Complementary Color Pairs
Choose complementary colors positioned opposite each other on the color wheel for maximum visual separation. Blue-orange combinations work exceptionally well for demographic data, while purple-yellow pairs excel in environmental mapping. Red-cyan contrasts create powerful emphasis for emergency response maps. Test your chosen pairs at various saturation levels to ensure they maintain distinction across different data values without creating visual fatigue.
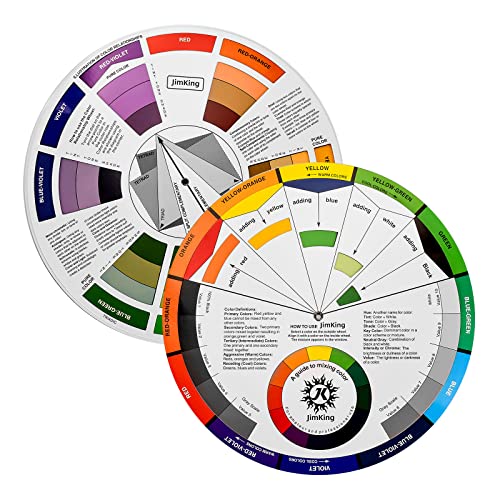
Easily organize and understand color relationships with this rotating color wheel. Ideal for artists and designers, it features a durable, UV-coated design for lasting use and clear color identification.
Balancing Brightness Levels
Maintain consistent brightness values between contrasting colors to prevent one hue from dominating your map’s visual hierarchy. Use HSB color models to match lightness levels while keeping hues distinct. Bright yellows paired with dark blues require careful calibration to avoid readability issues. Apply the squint testâif one color disappears when you squint, adjust the brightness balance until both remain equally visible.
When to Use High-Contrast Schemes
Deploy high-contrast palettes for dashboard displays, presentation maps, and digital interfaces where immediate data recognition is crucial. These schemes excel in categorical data visualization, political boundary mapping, and comparative analysis where clear visual separation drives decision-making. Avoid high-contrast approaches for subtle environmental data or scientific publications where nuanced color transitions better represent data continuity and professional standards.
Cool Blues and Teals: Professional Palettes for Corporate Mapping
Cool color palettes establish trust and professionalism while reducing visual fatigue during extended map interaction sessions. These schemes work exceptionally well in corporate environments where data credibility and user comfort take priority.
Creating Calming Visual Hierarchies
Build your visual hierarchy using progressive teal saturation levels from light cyan (#E0F2F1) to deep teal (#004D40). Start with the lightest tones for background elements and progress through medium teals (#26A69A) for secondary features. Reserve the darkest blues (#1A237E) for primary data points and ensure adequate contrast ratios exceed 4.5:1 for accessibility compliance. Test your hierarchy on both desktop monitors and mobile devices.
Experience smooth, tear-free gaming and video with the Acer KB272 G0bi 27" Full HD monitor, featuring Adaptive-Sync (FreeSync Compatible) and a rapid 1ms response time. Enjoy vibrant colors with 99% sRGB coverage and versatile connectivity through HDMI and VGA ports.

Incorporating Supporting Neutral Tones
Pair cool blues with warm grays (#F5F5F5 to #424242) to prevent visual coldness and maintain professional aesthetics. Use soft off-whites (#FAFAFA) for map backgrounds and incorporate charcoal grays (#37474F) for text elements and borders. Add subtle warm undertones through beige accents (#F3E5AB) at 10-15% opacity for enhanced readability. Avoid pure whites and blacks that create harsh contrast against blue foundations.
Achieve a flawless, even complexion with e.l.f. Flawless Satin Foundation. This lightweight, vegan formula provides medium coverage and a semi-matte finish for all-day wear, while hydrating your skin with glycerin.

Perfect Settings for Cool Color Maps
Deploy cool palettes for financial dashboards displaying market data trends and quarterly performance metrics. Apply these schemes to healthcare facility maps where calming colors reduce patient anxiety during wayfinding. Implement blue-teal combinations for technology sector presentations and utilize them in educational mapping platforms where extended viewing sessions require eye comfort. Reserve these palettes for indoor mapping applications and digital-first environments.
Learn world geography with The World Game! Identify countries, flags, and capitals while boosting memory skills in this fun, educational card game for 2-5 players ages 8+.

Warm Sunset Hues: Orange and Red Palettes for Dynamic Presentations
Warm sunset palettes energize your mapping presentations with vibrant oranges and reds that capture attention while maintaining professional credibility. These color schemes excel at highlighting priority data and creating memorable visual experiences.
Blending Warm Color Gradients
Start with golden yellow as your lightest value and progress through deep orange to rich burgundy for smooth data transitions. You’ll achieve optimal gradient flow by maintaining consistent saturation levels while adjusting brightness incrementally. Keep your color steps between 15-20% brightness intervals to prevent harsh visual breaks. Test your gradients against white backgrounds to ensure readability, and verify that your darkest red maintains adequate contrast ratios for accessibility compliance.
Managing Color Temperature Balance
Balance warm dominance with strategic neutral anchors to prevent visual overwhelm in your mapping displays. You’ll need cool gray boundaries and white background spaces to provide visual rest areas between warm data regions. Limit your warm palette to 60% of total map area, allowing cooler neutrals to occupy remaining space. Use desaturated warm tones for secondary information layers, reserving your most vibrant oranges and reds for primary data features that require immediate attention.
Optimal Contexts for Warm-Toned Maps
Deploy warm palettes for presentations requiring immediate visual impact, particularly in marketing analytics, sales territory maps, and emergency response planning. You’ll find these colors excel in conference presentations where audience engagement is critical and lighting conditions favor bold color choices. Use warm schemes for population density maps, economic growth indicators, and traffic flow visualization where energy and movement concepts align naturally with your color psychology. Avoid warm palettes for environmental data or scientific publications requiring neutral analytical presentation.
Pastel Softness: Subtle Palettes for Delicate Map Aesthetics
Pastel palettes offer a refined approach to map design, creating gentle visual experiences that won’t overwhelm your audience. These soft color schemes work particularly well for demographic maps, environmental studies, and educational materials where subtle data communication takes precedence over dramatic visual impact.
Achieving Gentle Color Transitions
Build smooth gradients using adjacent pastel hues on the color wheel to create seamless transitions between data categories. Start with a base color at 20-30% saturation and adjust lightness values by 15-20% increments across your data range. Test color progressions using tools like ColorBrewer to ensure perceptual uniformity across your palette. Blend complementary pastels like soft pink and mint green for categorical data, maintaining consistent saturation levels to preserve visual harmony throughout your map design.
Maintaining Readability with Light Tones
Increase contrast ratios between pastel fills and text elements by using darker neutral grays (70-80% black) for labels and boundaries. Apply subtle outlines around polygon features using colors that are 40-50% darker than your fill colors to maintain feature distinction. Consider background selection carefully, opting for pure white or very light grays to maximize the visibility of your pastel elements. Test readability across different devices and lighting conditions since pastel maps can lose definition on lower-quality displays.
Best Practices for Pastel Map Design
Reserve pastel palettes for data with low variance or when creating maps for sensitive topics like healthcare demographics or educational statistics. Combine with strategic accent colors using one or two darker tones to highlight critical features without disrupting the overall gentle aesthetic. Maintain consistent saturation levels across all palette elements, keeping values between 15-35% to preserve the soft visual character. Provide clear legends with larger color swatches since pastel differences can be subtle, and consider adding pattern fills for accessibility compliance.
Dark Mode Elegance: Night-Themed Palettes for Modern Applications
Dark-themed map palettes offer sophisticated alternatives to traditional light backgrounds, reducing eye strain while creating striking visual presentations. These night-mode color schemes enhance data readability in low-light environments and provide professional aesthetics for dashboard applications.
Working with Dark Backgrounds
Choose deep charcoal (#2B2B2B) or midnight blue (#1A1A2E) as your base background color rather than pure black to maintain visual depth. These darker foundations create sufficient contrast without causing harsh transitions that strain viewer eyes during extended map interactions.
Select complementary light accent colors strategically to establish clear visual hierarchy across your cartographic data. Soft whites (#F8F8F8) and light grays (#E0E0E0) work effectively for primary features, while muted pastels provide secondary data distinction without overwhelming the dark aesthetic foundation.
Creating Contrast with Light Elements
Implement bright accent colors sparingly to highlight critical map features without disrupting the overall dark theme coherence. Electric blues (#00D4FF), vibrant greens (#00FF88), and warm yellows (#FFD700) create powerful focal points when applied to essential data layers or navigation elements.
Layer your contrast elements systematically, using the brightest colors for the most important information and progressively dimmer tones for supporting details. This approach ensures optimal readability while maintaining the sophisticated dark mode aesthetic that reduces cognitive load during data analysis sessions.
Technical Considerations for Dark Maps
Test your dark palette combinations across multiple display types including LCD monitors, mobile devices, and projection screens to ensure consistent readability. Different screen technologies render dark colors variably, potentially affecting your map’s visual impact and data interpretation accuracy in presentation environments.
Configure your color values using RGB specifications rather than CMYK to optimize digital display performance. Dark backgrounds require precise color calibration to prevent banding effects and maintain smooth gradients, particularly when transitioning between similar dark tones in your mapping software’s rendering engine.
Conclusion
Your map’s visual success depends on choosing the right color palette that aligns with your specific goals and audience needs. These seven diverse approaches give you the flexibility to create compelling cartographic designs that communicate effectively across different contexts.
Remember that color psychology plays a crucial role in how viewers interpret your spatial data. Whether you’re presenting to executives with cool professional tones or engaging students with warm vibrant hues your palette choice should enhance rather than distract from your message.
Test your selected palette across multiple devices and viewing conditions to ensure consistent readability. The most beautiful color scheme won’t serve its purpose if it creates accessibility barriers or fails to display properly on different screens.
Start experimenting with these palette ideas in your next mapping project and you’ll discover how the right colors can transform raw data into powerful visual narratives that resonate with your audience.
Frequently Asked Questions
What is the importance of color palettes in map design?
Color palettes directly influence how viewers interpret spatial information and navigate cartographic data. The right color scheme transforms raw data into compelling visual stories, making it easier for audiences to understand complex information. Poor color choices create cognitive barriers that prevent users from extracting meaningful insights from maps.
When should I use sequential color schemes?
Sequential color schemes work best for continuous data ranges where values progress from low to high. They’re ideal for displaying population density, elevation data, temperature readings, or any dataset where gradual transitions between values need clear visual representation through progressively darker or lighter color variations.
What are the benefits of monochromatic color palettes?
Monochromatic palettes offer sophisticated visual hierarchy while maintaining design consistency. They work exceptionally well for choropleth maps displaying single-variable continuous data and are particularly effective in professional settings where visual sophistication is essential. They also ensure adequate contrast for both screen and print viewing.
How do earth tone palettes enhance map readability?
Earth tone palettes draw from nature’s inherent color relationships, creating maps that feel organic and intuitive. Browns and greens anchor these palettes, representing terrestrial features naturally. They’re particularly effective for topographic mapping, environmental studies, and historical maps where familiar color associations enhance storytelling.
When should I use high-contrast color palettes?
High-contrast palettes are ideal for dashboard displays, categorical data visualization, and situations requiring immediate visual impact. They work well in digital environments where clear data distinction is crucial. However, avoid them for subtle environmental data or scientific publications that require nuanced color transitions.
What are the advantages of cool blue and teal palettes?
Cool blue and teal palettes establish trust and professionalism while reducing visual fatigue during extended map interactions. They’re perfect for financial dashboards, healthcare facility maps, technology presentations, and educational platforms, particularly in indoor and digital-first environments where professional aesthetics are important.
How do pastel palettes improve map accessibility?
Pastel palettes create gentle visual experiences that reduce eye strain and provide refined aesthetics. They’re excellent for demographic maps, environmental studies, and educational materials. When combined with darker neutral colors for text and strategic accent colors, they maintain readability while preserving a soft, approachable aesthetic.
What are the benefits of dark-themed map palettes?
Dark-themed palettes reduce eye strain and enhance data readability in low-light environments. They provide sophisticated alternatives to traditional light backgrounds and work well for digital displays. Deep charcoal or midnight blue bases maintain visual depth while bright accent colors create clear hierarchy for critical features.