
7 Visual Contrast Strategies That Enhance Map Readability
Why it matters: You can’t create effective maps without mastering visual contrast – it’s what separates amateur cartography from professional geographic storytelling.
The big picture: Visual contrast in map design determines whether your audience instantly grasps spatial relationships or struggles to decode cluttered information. Smart cartographers use seven proven contrast strategies to guide readers’ eyes through complex geographic data.
Explore and map the wilderness for the Queen in Cartographers! Draw unique terrain shapes and score points based on randomly selected goals each game, but beware of monster ambushes.

What’s next: These contrast techniques will transform how you approach everything from color selection to typography placement in your maps.
Disclosure: As an Amazon Associate, this site earns from qualifying purchases. Thank you!
P.S. check out Udemy’s GIS, Mapping & Remote Sensing courses on sale here…
Understanding Visual Contrast in Cartographic Design
Visual contrast forms the foundation of effective map communication by creating clear distinctions between geographic elements. You’ll find that mastering these principles directly impacts how quickly users can interpret spatial relationships.
Achieve a flawless, even complexion with e.l.f. Flawless Satin Foundation. This lightweight, vegan formula provides medium coverage and a semi-matte finish for all-day wear, while hydrating your skin with glycerin.

Definition and Importance of Visual Contrast
Visual contrast in cartography refers to the deliberate differentiation between map elements through color, size, shape, and texture variations. You create effective contrast when map features stand out distinctly from their surroundings, allowing viewers to identify boundaries, patterns, and hierarchies instantly. Strong contrast reduces cognitive load and prevents misinterpretation of critical geographic information. Professional cartographers rely on contrast principles to guide viewer attention and establish clear visual hierarchies that support decision-making processes.
Role of Contrast in Map Readability and Communication
Contrast directly controls map readability by determining how easily users can distinguish between different data layers and geographic features. You’ll notice that high-contrast maps enable faster pattern recognition and reduce eye strain during extended viewing sessions. Poor contrast forces viewers to work harder to extract information, leading to errors in spatial analysis and navigation. Effective contrast strategies ensure that essential map elements like roads, boundaries, and landmarks remain visible across different viewing conditions and display technologies.
Color Contrast: Creating Distinction Through Hue and Saturation
Color contrast serves as your primary tool for establishing visual hierarchy and ensuring map elements remain distinct across different viewing conditions. Strategic color selection transforms confusing spatial data into clear, interpretable geographic information.
Using Complementary Colors for Maximum Impact
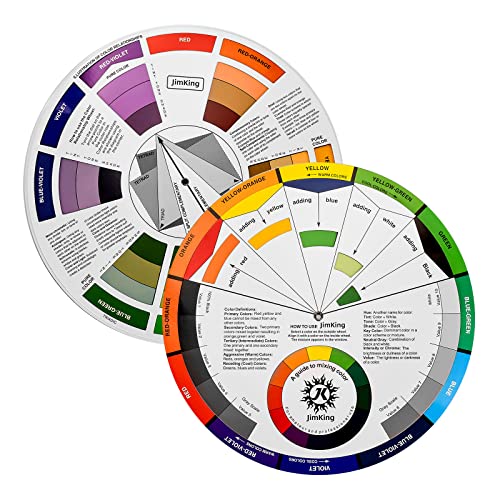
Complementary color pairs create the strongest visual separation in cartographic design. You’ll achieve maximum contrast by positioning opposite colors on the color wheel—red with green, blue with orange, or purple with yellow. These combinations work exceptionally well for distinguishing political boundaries, land use categories, or elevation zones. Professional cartographers often use blue-orange schemes for water-land distinctions and red-green combinations for population density mapping, ensuring critical geographic features stand out immediately.
Easily organize and understand color relationships with this rotating color wheel. Ideal for artists and designers, it features a durable, UV-coated design for lasting use and clear color identification.
Balancing Warm and Cool Color Schemes
Warm colors advance visually while cool colors recede, creating natural depth perception in your maps. You can use warm tones like reds, oranges, and yellows for foreground elements such as urban areas, transportation networks, or high-priority features. Cool blues, greens, and purples work best for background elements like water bodies, vegetation, or low-density areas. This temperature-based approach helps viewers process spatial relationships intuitively, with warm features appearing closer and more prominent than cool background elements.
Avoiding Color Combinations That Reduce Accessibility
Color accessibility affects approximately 8% of male and 0.5% of female map users who experience color vision deficiencies. You should avoid red-green combinations for critical information, as these colors appear similar to users with deuteranopia or protanopia. Instead, use blue-yellow contrasts or incorporate additional visual cues like patterns, textures, or symbols. Testing your color schemes with accessibility tools like ColorBrewer or Stark ensures your maps remain functional for all users, meeting WCAG 2.1 guidelines for digital cartographic products.
Value Contrast: Leveraging Light and Dark Elements
Value contrast creates the fundamental visual framework that makes geographic information readable and actionable. You’ll achieve stronger map communication by mastering the strategic placement of light and dark elements across your cartographic compositions.
Implementing Grayscale Variations for Hierarchy
Grayscale mapping establishes clear information hierarchies through systematic tonal progressions from white to black. You can assign darker values to primary features like major highways or urban centers while using lighter tones for secondary elements such as minor roads or rural boundaries. This approach works particularly well for reference maps where you need users to distinguish between administrative levels or transportation networks without color distractions.
Creating Depth Through Tonal Differences
Tonal variation simulates three-dimensional depth on flat map surfaces by mimicking natural light and shadow patterns. You’ll create realistic terrain representation by applying darker values to valley floors and lighter tones to elevated ridges and peaks. This technique proves especially effective for topographic maps where elevation changes must be immediately apparent to users navigating challenging terrain or planning outdoor activities.
Plan your next adventure with the 2025 National Geographic Road Atlas, covering the United States, Canada, and Mexico. Its durable, folded format (11 x 15 in) makes it ideal for hiking and camping trips.

Using Value Contrast for Emphasis and Focus
Strategic value placement directs viewer attention to critical map elements through deliberate light-dark juxtaposition. You can highlight emergency evacuation routes by surrounding them with darker background elements or emphasize points of interest using bright symbols against subdued base layers. This selective emphasis prevents visual overload while ensuring users quickly locate essential information during time-sensitive decision-making situations.
Size Contrast: Establishing Visual Hierarchy Through Scale
Size contrast builds upon color and value strategies by using scale variations to direct viewer attention and establish clear information hierarchies in your cartographic designs.
Varying Symbol Sizes for Data Classification
Graduated symbols create intuitive data representation by scaling marker sizes proportionally to attribute values. You’ll implement this technique most effectively with point data like population centers, where larger circles represent higher values and smaller ones indicate lower magnitudes. Consider using three to five size classes to avoid visual clutter while maintaining clear distinctions between data categories. This approach works exceptionally well for demographic maps, economic indicators, and environmental monitoring stations.
Creating Proportional Relationships in Map Elements
Proportional scaling ensures your map elements maintain logical size relationships that reflect real-world spatial hierarchies. You should size primary roads wider than secondary routes, major rivers broader than tributaries, and administrative boundaries according to their governmental importance. Establish a consistent scaling ratio—typically 1.5:1 or 2:1 between hierarchy levels—to create predictable visual patterns. This systematic approach helps viewers quickly identify feature importance without consulting legends repeatedly.
Balancing Large and Small Design Components
Visual equilibrium requires strategic placement of large and small elements to prevent overwhelming or underwhelming specific map regions. You’ll achieve optimal balance by distributing major features across your composition while using smaller elements to fill visual gaps and provide supporting detail. Apply the rule of thirds when positioning dominant features, and ensure your largest symbols don’t exceed 5% of total map area to maintain readability of surrounding information.
Shape Contrast: Differentiating Elements Through Form
Shape contrast creates distinct visual categories by alternating between different geometric forms across your cartographic design. You’ll establish clear functional relationships when transportation networks use linear elements while settlement areas employ circular or polygonal shapes.
Combining Geometric and Organic Shapes
Geometric shapes work best for human-made features like administrative boundaries, transportation infrastructure, and urban planning zones. You can represent these elements using precise squares, circles, triangles, and hexagons that reflect their engineered nature. Organic shapes enhance natural feature representation including coastlines, river systems, forest boundaries, and topographic contours. This geometric-organic pairing creates immediate visual distinction between built and natural environments, helping viewers quickly categorize different map elements without requiring additional cognitive processing.
Using Angular Versus Curved Design Elements
Angular elements direct attention to critical decision points such as road intersections, political boundaries, and warning symbols on navigation maps. Sharp corners and straight edges create visual tension that draws the eye to important locations. Curved elements provide visual flow for representing natural phenomena like weather patterns, elevation contours, and hydrographic features. You’ll achieve optimal contrast by strategically mixing angular point symbols with curved line work, ensuring that infrastructure elements stand apart from environmental features while maintaining overall design harmony.
Creating Visual Interest Through Shape Variation
Shape variation prevents visual monotony across complex thematic maps containing multiple data categories. You can employ different polygon shapes for land use classifications, varied point symbols for facility types, and distinct line patterns for transportation modes. Systematic shape families maintain logical groupings while providing sufficient contrast – use circular variations for population data, triangular sets for elevation markers, and rectangular forms for infrastructure elements. This approach ensures viewers can distinguish between data categories while recognizing relationships within each thematic group.
Texture Contrast: Adding Depth Through Pattern and Surface
Texture contrast creates visual separation through surface patterns, allowing you to differentiate geographic elements without relying solely on color variations. This technique proves especially valuable when working with limited color palettes or designing for monochrome printing applications.
Incorporating Smooth Versus Rough Visual Textures
Smooth textures work best for water bodies, urban areas, and transportation networks where clean lines emphasize human development. Apply solid fills or minimal dot patterns to create these refined surfaces. Rough textures effectively represent natural features like forests, agricultural lands, and mountainous terrain. Use crosshatching, stippling, or irregular dot patterns to simulate organic surfaces and create immediate visual distinction between developed and undeveloped areas.
Using Patterns to Distinguish Geographic Areas
Diagonal line patterns at varying angles separate adjacent political boundaries or land use categories without color confusion. Rotate hatch patterns 45 degrees apart to maintain clear visual separation. Dot density patterns effectively represent population data or agricultural intensity, with closer spacing indicating higher values. Combine multiple pattern types—vertical lines for residential zones, horizontal lines for commercial areas, and crosshatching for industrial districts—to create comprehensive thematic classifications.
Balancing Detailed and Simple Surface Treatments
Simple surface treatments anchor your map’s visual hierarchy by providing rest areas for the eye between complex pattern zones. Reserve solid fills or minimal textures for background elements like water bodies or major transportation corridors. Detailed surface treatments should highlight critical data layers without overwhelming the overall composition. Apply intricate patterns sparingly to 2-3 key feature classes, ensuring pattern density decreases with distance from primary focal points.
Typography Contrast: Enhancing Readability Through Font Variation
Typography contrast establishes information hierarchy through strategic font differentiation, ensuring that text elements remain legible at various scales. You’ll create visual distinction between map labels, legends, and annotations by varying typeface families, weights, and sizes systematically.
Mixing Serif and Sans-Serif Typefaces Effectively
Serif fonts work best for place names and longer text blocks because they guide the eye along horizontal lines naturally. You’ll achieve optimal contrast by pairing serif typefaces for primary geographic features with sans-serif fonts for technical annotations like coordinates and scale indicators. Reserve decorative serif fonts like Times New Roman for historical maps, while choosing clean sans-serif options like Helvetica for modern thematic cartography.
Creating Hierarchy Through Font Weight and Size
Font weight variations establish clear information rankings across your cartographic elements. You’ll implement bold weights for primary cities and major geographic features, medium weights for secondary locations, and light weights for supplementary information. Scale your text sizes proportionally: 14-16pt for major labels, 10-12pt for secondary features, and 8-9pt for detailed annotations, maintaining consistent ratios across different map projections.
Ensuring Legibility Across Different Map Scales
Scale-dependent typography prevents text crowding and maintains readability during zoom operations. You’ll set minimum font sizes at 8pt for digital maps and 10pt for print cartography, adjusting letter spacing by 0.5-1pt increments for smaller text. Test your typography at 50%, 100%, and 200% viewing scales, ensuring that critical labels remain readable while secondary text gracefully disappears at smaller scales through conditional visibility settings.
Spatial Contrast: Managing White Space and Element Density
Spatial contrast creates visual hierarchy through strategic distribution of map elements and intentional use of empty space. You’ll achieve clearer communication by controlling where elements cluster and where they breathe.
Creating Breathing Room Around Important Features
Buffer zones around critical features prevent visual competition and enhance recognition speed. You should maintain minimum spacing of 0.25 inches around primary labels and 0.125 inches around secondary text elements when designing at standard print scales. Major cities and landmark symbols require larger buffer zones—typically 0.5 inches—to establish their importance in the spatial hierarchy. Strategic placement of these breathing spaces guides viewer attention naturally toward essential geographic information while preventing overcrowded compositions that reduce map usability.
Balancing Dense and Sparse Map Areas
Distribute complex information across your map canvas to prevent cognitive overload in any single viewing area. Urban centers naturally contain dense symbol clusters, so you’ll balance this by simplifying surrounding rural areas through selective feature removal and increased spacing between remaining elements. Apply the 60-30-10 rule: allocate 60% sparse areas, 30% moderate density, and 10% high-density zones across your composition. This distribution maintains visual equilibrium while ensuring that information-rich areas receive adequate attention without overwhelming viewers during spatial analysis tasks.
Using Negative Space for Visual Relief
Empty areas function as active design elements that enhance overall map comprehension and reduce visual fatigue. You’ll leverage ocean areas, large parks, and agricultural zones as natural negative spaces that provide visual rest points between complex geographic features. Strategic negative space placement creates implied boundaries and groupings without additional graphic elements, allowing viewers to process information more efficiently. Position these relief areas to break up dense urban corridors and separate distinct thematic regions, ensuring your audience can navigate complex geographic data without experiencing visual overwhelm.
Conclusion
Mastering these seven visual contrast strategies will transform your cartographic designs from cluttered confusion into clear compelling narratives. When you thoughtfully combine color value size shape texture typography and spatial contrasts you’ll create maps that communicate geographic information with precision and impact.
Remember that effective contrast isn’t about using every technique simultaneously—it’s about selecting the right combination for your specific audience and purpose. Your maps should guide viewers naturally through the information without overwhelming them with competing visual elements.
Start implementing these strategies one at a time in your next project. You’ll quickly notice how strategic contrast decisions enhance both the aesthetic appeal and functional clarity of your cartographic work making complex geographic data accessible to any audience.
Frequently Asked Questions
What is visual contrast in map design?
Visual contrast is the deliberate differentiation between map elements through variations in color, size, shape, and texture. It allows viewers to instantly identify boundaries, patterns, and hierarchies in geographic data. Strong contrast creates clear distinctions between different features, making maps easier to read and understand while reducing cognitive load.
Why is visual contrast important for cartography?
Visual contrast is essential because it helps audiences quickly understand spatial relationships and prevents confusion when interpreting geographic information. It forms the foundation of effective map communication, enables faster pattern recognition, reduces eye strain, and prevents errors in spatial analysis and navigation.
What are complementary color pairs in map design?
Complementary color pairs are opposite colors on the color wheel, such as red-green and blue-orange, that create strong visual separation. They’re particularly effective for distinguishing features like political boundaries and land use categories. However, avoid red-green combinations for accessibility reasons due to color vision deficiencies.
How does value contrast work in maps?
Value contrast uses light and dark elements to create a visual framework that enhances readability. Darker values are assigned to primary features while lighter tones represent secondary elements. This technique can simulate three-dimensional depth on flat surfaces and direct viewer attention to critical map information.
What is size contrast in cartography?
Size contrast establishes visual hierarchy through scale variations, directing viewer attention effectively. It includes graduated symbols where varying marker sizes represent data values, particularly useful for point data like population centers. Maintaining consistent scaling ratios ensures that primary features appear proportionally larger than secondary ones.
How does shape contrast improve map design?
Shape contrast differentiates elements through form, establishing clear functional relationships. Geometric shapes work best for human-made features, while organic shapes enhance natural feature representation. Angular shapes draw attention to critical points, while curved shapes provide visual flow for natural phenomena.
What role does texture contrast play in maps?
Texture contrast creates visual separation through surface patterns, allowing differentiation without relying solely on color. Smooth textures typically represent urban areas and transportation networks, while rough textures represent natural features like forests and mountains. Patterns like diagonal lines help distinguish geographic areas effectively.
How does typography contrast enhance map readability?
Typography contrast uses strategic font variation to improve readability through different typeface families, weights, and sizes. Serif fonts work well for place names and longer text, while sans-serif options suit technical annotations. Proper font hierarchy ensures information is clearly organized and accessible.
What is spatial contrast in cartography?
Spatial contrast focuses on strategic distribution of map elements and intentional use of white space to create visual hierarchy. It includes maintaining buffer zones around critical features, balancing dense and sparse areas, and using negative space as an active design element to enhance comprehension.
How can I ensure my map is accessible to all users?
Test color schemes with accessibility tools and follow WCAG 2.1 guidelines for digital maps. Avoid red-green color combinations, use alternative contrasts like value and texture, and provide visual cues beyond color alone. Consider users with color vision deficiencies when selecting your color palette.