5 Ideas for Conveying Conflict Through Map Aesthetics That Create Visual Impact
Maps aren’t just navigation tools—they’re powerful storytelling devices that can transform abstract conflicts into visceral visual experiences. Why it matters: The right aesthetic choices can make viewers feel the tension of disputed territories the weight of historical battles and the chaos of ongoing struggles without reading a single word.
Your map’s visual language speaks volumes about the conflicts it portrays. Whether you’re designing for a video game historical documentary or educational presentation the aesthetic elements you choose—from color schemes to typography—directly impact how audiences perceive and understand complex geopolitical situations.
Disclosure: As an Amazon Associate, this site earns from qualifying purchases. Thank you!
Use Color Contrast to Show Territorial Divisions
Color contrast creates immediate visual separation between opposing forces and contested regions. Strategic color choices help viewers instantly identify territorial boundaries and understand the scale of conflict across your mapped area.
P.S. check out Udemy’s GIS, Mapping & Remote Sensing courses on sale here…
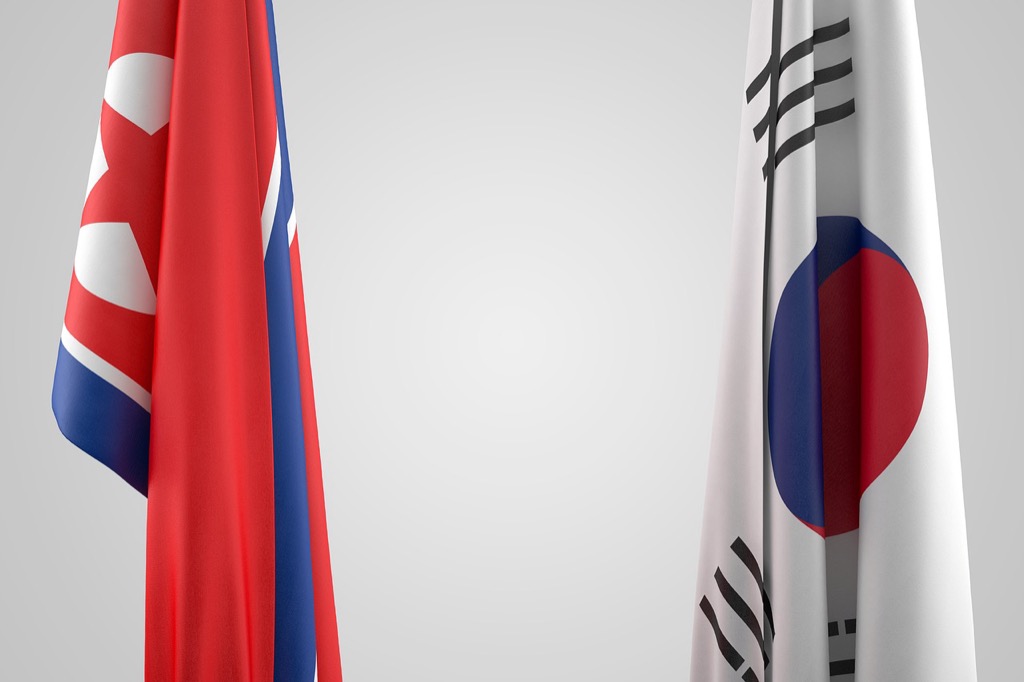
Implement Bold Opposing Colors for Enemy Factions
Bold opposing colors like deep red and navy blue create instant visual tension between warring factions. These high-contrast combinations work particularly well when you’re mapping World War battlefronts or fantasy realm conflicts. Avoid adjacent colors on the color wheel since they’ll blur territorial boundaries and confuse viewers about who controls which areas.
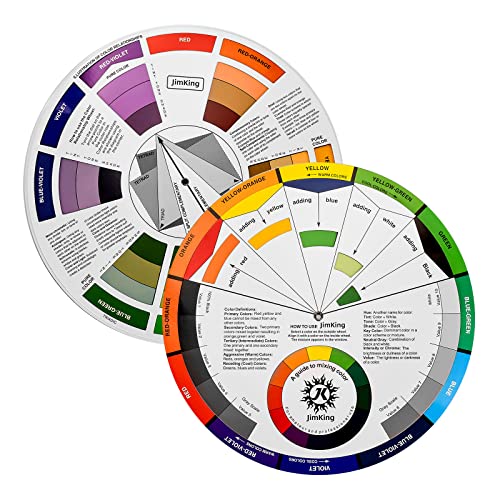
Easily organize and understand color relationships with this rotating color wheel. Ideal for artists and designers, it features a durable, UV-coated design for lasting use and clear color identification.
Apply Gradual Color Transitions for Contested Zones
Gradual color transitions using intermediate hues effectively show disputed territories between opposing factions. You can blend enemy faction colors at 50-75% opacity to create buffer zones that feel genuinely contested. This technique works especially well for civil war maps where territorial control shifts frequently and boundaries remain fluid.
Utilize Monochromatic Schemes for Neutral Areas
Monochromatic schemes using gray or beige tones clearly distinguish neutral territories from active conflict zones. These muted colors prevent neutral areas from competing visually with your faction territories while maintaining map readability. Keep neutral zone saturation below 30% to ensure they recede into the background without disappearing completely from view.
Create Visual Tension Through Asymmetrical Design Elements
Asymmetrical layouts disrupt viewer expectations and create the visual unease that mirrors actual conflict dynamics. This design approach moves beyond traditional centered compositions to reflect the chaotic nature of territorial disputes.
Position Key Locations Off-Center for Dynamic Balance
Place critical battlegrounds and strategic cities away from your map’s center to create visual instability that mirrors conflict unpredictability. Position the most contested location in the upper-left quadrant while balancing it with secondary conflict zones in the lower-right. This off-center arrangement forces viewers’ eyes to actively search the map rather than passively absorbing information from a predictable focal point.
Vary Symbol Sizes to Represent Power Imbalances
Scale military symbols and settlement markers disproportionately to show the stark reality of unequal forces in conflict zones. Use oversized icons for dominant military installations while representing smaller guerrilla outposts with minimal markers. This size variation creates visual hierarchy that immediately communicates which faction holds tactical advantages, making power dynamics clear without requiring detailed legends or explanatory text.
Incorporate Jagged Borders Instead of Smooth Lines
Replace clean territorial boundaries with irregular, fractured edges that reflect the volatile nature of contested regions. Draw frontlines using sharp angles and broken segments rather than flowing curves to represent the unstable reality of active conflict zones. These jagged elements create visual tension that smooth borders cannot achieve, suggesting the constant threat of boundary shifts and territorial changes.
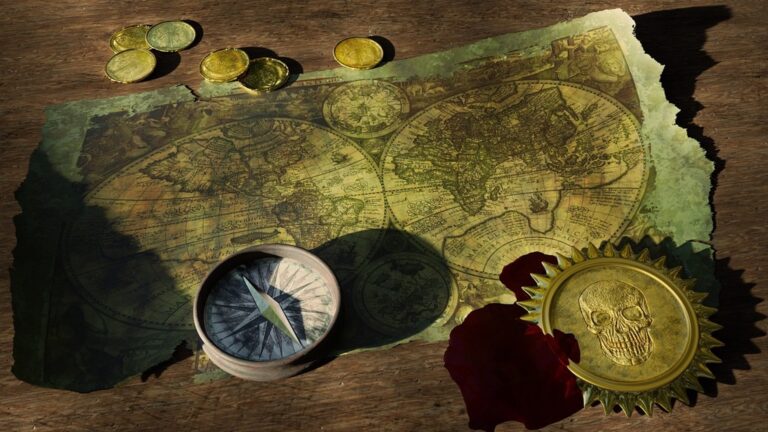
Employ Weathered and Damaged Visual Effects
Physical deterioration tells the story of conflict’s lasting impact on landscapes and communities. These visual elements transform sterile cartographic representations into compelling narratives that communicate the human cost of territorial disputes.
Add Torn Edges and Burn Marks to Map Sections
Torn paper effects immediately suggest damaged documents recovered from abandoned command posts or war zones. You’ll create authentic distress by applying irregular edge masks that follow natural tear patterns rather than geometric shapes. Burn marks work particularly well around strategic locations like military bases or contested cities, using gradient overlays that transition from deep brown to orange-red. Position these effects asymmetrically to avoid artificial symmetry, focusing damage on areas where conflicts would logically cause the most destruction to mapping materials.
Include Faded Text and Worn Pathways
Faded typography communicates the passage of time and the erosion of established territorial claims. Reduce opacity on settlement names in disputed regions to 40-60% while maintaining full visibility for secure areas. Worn pathway effects simulate roads damaged by military movement and supply convoys. Apply subtle erosion masks to major transportation routes, creating gaps and weathered sections that suggest infrastructure breakdown. Use desaturated colors for these pathways, transitioning from bold lines to sketchy, interrupted strokes that reflect the uncertainty of safe passage.
Show Battle Scars Through Crossed-Out Locations
Crossed-out settlements provide immediate visual evidence of territorial losses and strategic retreats. Draw deliberate strike-through marks using rough brush textures rather than clean lines, mimicking hasty field annotations made during active operations. Annotated battle scars work effectively when you overlay small symbols like explosion markers or military strike indicators near affected locations. Position these markings at slight angles to suggest urgent field updates, and vary the opacity to indicate different time periods of conflict activity.
Integrate Conflicting Typography Styles
Typography choices create immediate visual hierarchy and emotional response in conflict mapping. Contrasting font families communicate competing forces through visual discord that mirrors territorial tensions.
Combine Elegant Fonts with Harsh Military Text
Pair serif fonts with bold sans-serif typefaces to represent opposing factions on your conflict maps. Use elegant fonts like Times New Roman for established governments and harsh military stencils for rebel forces. This contrast creates immediate visual tension between legitimate authority and insurgent movements. Place these conflicting styles at territorial boundaries where opposing forces meet to emphasize the clash between order and chaos.
Use Different Font Weights to Show Dominance
Apply heavy font weights to represent dominant military powers while using lighter weights for weaker factions. Bold 700-weight typography commands attention for major cities under government control, while 300-weight fonts suggest areas with limited authority. Scale font sizes proportionally to troop concentrations or territorial control percentages. This weight variation creates visual power dynamics that viewers immediately understand without reading detailed legends.
Apply Overlapping Text to Represent Competing Claims
Layer text elements at different opacities to show disputed territories where multiple factions claim control. Position overlapping labels with 60-70% opacity so both names remain visible but create visual confusion. Use contrasting colors like red and blue text to represent competing claims over the same geographic area. This overlapping technique forces viewers to experience the complexity of territorial disputes through typography that literally conflicts on screen.
Layer Symbolic Elements to Represent Ongoing Struggle
Strategic symbol placement transforms peaceful cartographic foundations into powerful conflict narratives. You’ll create compelling visual tension by juxtaposing symbols of war against serene geographical backdrops.
Achieve a flawless, even complexion with e.l.f. Flawless Satin Foundation. This lightweight, vegan formula provides medium coverage and a semi-matte finish for all-day wear, while hydrating your skin with glycerin.

Place Military Icons Over Peaceful Imagery
Position tank symbols directly on pastoral farmland or residential neighborhoods to show invasion’s disruption of civilian life. You can overlay helicopter icons on school districts and hospital zones to emphasize targeted infrastructure threats. Place missile markers over cultural landmarks like churches or museums to highlight heritage destruction. These stark contrasts force viewers to confront how conflict shatters normal community functions.
Show Broken Infrastructure and Damaged Landmarks
Replace standard road symbols with fractured line segments that end abruptly at crater markers. You’ll communicate infrastructure collapse by showing bridge icons with diagonal strike-through marks and rubble pile symbols. Use partially filled building icons instead of complete structures to represent damaged facilities. Add explosion burst symbols near critical infrastructure like power plants or water treatment facilities to show strategic targeting patterns.
Include Movement Arrows Indicating Troop Movements
Draw bold directional arrows converging on population centers to show encirclement tactics and siege formations. You can use dotted movement lines to represent guerrilla infiltration routes through mountainous terrain or urban areas. Place opposing arrow systems in different colors to show flanking maneuvers and counter-offensive strategies. Stack multiple arrow layers at varying transparencies to illustrate complex multi-front operations and shifting battle lines over time.
Conclusion
Your maps can become powerful storytelling instruments when you thoughtfully combine these aesthetic techniques. By layering color contrasts with weathered textures and strategic typography choices you’ll create visual narratives that speak to viewers on an emotional level.
Remember that effective conflict mapping isn’t about overwhelming your audience with effects. It’s about selecting the right combination of elements that serve your specific narrative goals. Whether you’re designing for educational content or entertainment each technique should enhance rather than distract from your story’s core message.
The key lies in understanding that every visual choice communicates something to your viewers. When you master these aesthetic principles you’ll transform ordinary maps into compelling visual stories that capture the complexity and human impact of territorial conflicts.
Frequently Asked Questions
What makes maps effective storytelling tools beyond navigation?
Maps become powerful storytelling tools through visual elements like color schemes, typography, and symbol placement that convey emotional weight and historical context. They can communicate the tension and chaos of conflicts without text, making complex geopolitical issues immediately understandable through aesthetic choices that influence viewers’ perceptions and emotional responses.
How do color contrasts enhance map storytelling?
Color contrast creates immediate visual separation between opposing forces and contested regions, helping viewers identify territorial boundaries and conflict scale. Bold opposing colors like deep red and navy blue generate visual tension between enemy factions, while gradual transitions represent disputed zones and monochromatic schemes keep neutral areas from competing with active conflict zones.
What role does asymmetrical layout play in conflict mapping?
Asymmetrical layouts disrupt viewer expectations and reflect the chaotic nature of territorial disputes. Positioning key locations off-center creates dynamic balance and visual instability, compelling viewers to engage more actively with the map while communicating the unpredictable and unstable nature of conflict zones through design choices.
How can typography enhance territorial tension visualization?
Contrasting font families create visual discord that mirrors territorial tensions. Pairing elegant serif fonts with harsh military stencils represents opposing factions, while different font weights indicate dominance levels. Overlapping text elements at varying opacities represent competing territorial claims, forcing viewers to engage with dispute complexity through conflicting typography.
What weathered effects communicate conflict impact effectively?
Torn edges, burn marks, faded text, and worn pathways illustrate conflict’s lasting impact on landscapes. Asymmetrical damage placement reflects logical destruction patterns, while desaturated colors and erosion masks signify infrastructure breakdown. Crossed-out locations with rough strike-through marks visually represent territorial losses and the dynamic nature of ongoing conflicts.
How do symbol placement strategies deepen narrative impact?
Strategic symbol juxtaposition creates compelling visual tension by placing military icons against peaceful imagery. Tank symbols over farmland and helicopter icons over schools highlight civilian life disruption. Fractured line segments depict broken infrastructure, while explosion symbols near facilities illustrate targeted attacks, forcing viewers to confront conflict realities.