7 Best Map Design Typography Tips
Typography can make or break your map design – and most cartographers don’t realize how much power they’re leaving on the table. Poor font choices create cluttered maps that confuse users while strategic typography guides viewers effortlessly through complex geographic information. You’ll discover seven proven techniques that transform amateur maps into professional-grade visualizations that actually communicate your data story.
Disclosure: As an Amazon Associate, this site earns from qualifying purchases. Thank you!
Choose the Right Font Families for Maximum Readability
Your font family selection determines whether map users can quickly process geographic information or struggle with unclear labels. Professional cartographers rely on three primary font categories, each serving distinct functions in effective map design.
Sans-Serif Fonts for Modern Clean Aesthetics
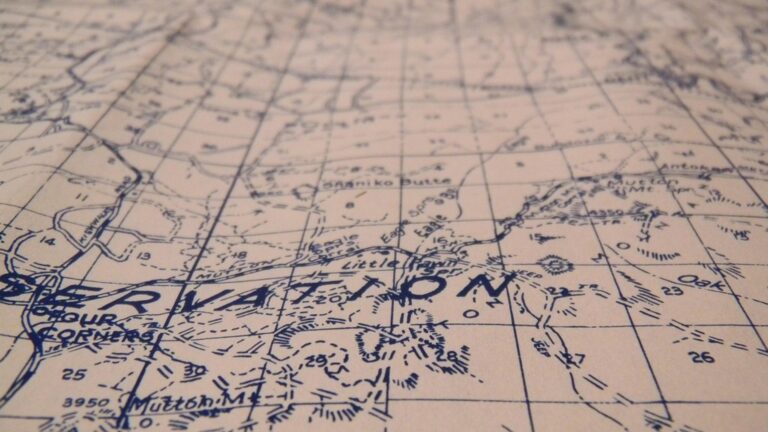
Sans-serif typefaces deliver optimal readability at small scales where map labels must remain crisp and legible. Helvetica, Arial, and Open Sans provide consistent character spacing that prevents letter confusion when displaying place names, street labels, and data annotations. You’ll find these fonts perform exceptionally well in digital mapping applications like ArcGIS Online and QGIS, maintaining clarity across zoom levels from continental views to neighborhood details.
P.S. check out Udemy’s GIS, Mapping & Remote Sensing courses on sale here…
Serif Fonts for Traditional Cartographic Appeal
Serif fonts establish visual hierarchy while evoking classic cartographic traditions found in historical atlases and reference maps. Times New Roman, Georgia, and Minion Pro work effectively for map titles, legends, and descriptive text blocks where readers have time to process detailed information. You should reserve serif typefaces for larger text elements since their decorative strokes can become illegible when reduced to standard label sizes below 8 points.
Script Fonts for Decorative Elements Only
Script typefaces serve purely decorative purposes in specialized cartographic contexts like tourist maps, historical recreations, or themed visualizations. Brush Script, Lucida Handwriting, and similar stylized fonts can enhance water feature labels or region names when used sparingly. You must avoid script fonts for critical navigation information, street names, or data labels since their ornate letterforms significantly reduce reading speed and comprehension under typical map viewing conditions.
Establish Clear Typographic Hierarchy Through Size Variation
Creating visual hierarchy through strategic size variations helps readers navigate complex geographic information efficiently. Professional cartographers use a three-tier approach to organize map text elements.
Large Headlines for Major Geographic Features
You’ll want to use 14-16 point sizes for primary geographic elements like countries, states, and major cities. These large headlines should dominate the visual hierarchy and appear first when viewers scan your map. Apply consistent sizing for elements of equal importance – all state names should match, while country names remain largest. Position these headlines to avoid overlapping boundaries and maintain clear association with their corresponding features.
Medium Text for Secondary Landmarks
Your medium-sized text should range from 10-12 points for secondary features like counties, smaller cities, and regional landmarks. This middle tier creates visual separation between major and minor elements while maintaining readability. Use this size for highway numbers, park names, and district labels that support navigation but don’t compete with primary features. Maintain consistent spacing around medium text to prevent visual crowding.
Small Labels for Minor Details and Annotations
Reserve 8-10 point text for detailed annotations, street names, and reference information that supports comprehensive map reading. These small labels fill gaps without overwhelming the primary hierarchy you’ve established. Apply this sizing to elevation markers, coordinate references, and supplementary data that enhance map utility. Keep small text proportional to map scale – what works at city level won’t function at regional scale.
Implement Strategic Color Contrasts for Better Legibility
Your color choices determine whether map users can quickly identify critical information or struggle to read essential details. Strategic color contrasts create visual separation between text elements and background features, ensuring optimal legibility across different viewing conditions.
High Contrast Combinations for Critical Information
Dark text on light backgrounds delivers maximum readability for essential map labels like city names and major highways. Use black (#000000) or dark navy (#1a1a2e) text against white or light gray backgrounds for primary navigation elements. Reverse this pattern with white text on dark backgrounds for nighttime map themes or high-contrast accessibility requirements. Test your combinations using a 4.5:1 contrast ratio minimum to meet WCAG standards for digital maps.
Subtle Color Variations for Background Elements
Muted color differences prevent background elements from competing with your primary typography hierarchy. Apply light gray (#f5f5f5) or pale blue (#f0f8ff) backgrounds behind secondary text blocks to create subtle separation without overwhelming main labels. Use colors within the same hue family but vary saturation levels by 20-30% to maintain visual cohesion. This approach works particularly well for elevation labels, coordinate grids, and supplementary annotations that support but don’t dominate your map’s information structure.
Consistent Color Coding Across Map Sections
Standardized color assignments create predictable reading patterns throughout your entire map project. Establish a color palette where specific hues always represent the same information types – blue for water features, green for parks, red for emergency services. Document your color codes in a style guide with exact hex values and apply them uniformly across all map sheets or digital zoom levels. This consistency reduces cognitive load for users and creates professional-quality cartographic products that communicate effectively across different map sections.
Master the art of concise writing with The Elements of Style. This classic guide offers clear rules and principles for effective communication.

Master Letter Spacing and Kerning for Professional Results
Precise letter spacing distinguishes professional cartographic work from amateur attempts. Your map’s credibility depends on typography that flows naturally while maintaining maximum readability across varying scales.
Adjusting Tracking for Dense Information Areas
Increase tracking by 0.02-0.05 em in crowded urban zones to prevent text collision and maintain legibility. Dense metropolitan areas require expanded letter spacing to accommodate multiple overlapping labels without creating visual chaos. Professional cartographers typically use 110-125% tracking for city centers while maintaining standard spacing for rural regions. This technique prevents label overcrowding and ensures critical navigation information remains accessible even when zoomed out.
Fine-Tuning Kerning for Curved Geographic Features
Optimize kerning pairs when labeling curved coastlines and mountain ranges to maintain consistent visual rhythm along irregular paths. Curved text placement requires manual kerning adjustments between specific letter combinations like “AV,” “WA,” and “TO” to prevent awkward gaps. Professional mapping software allows you to adjust individual character spacing while maintaining overall path alignment. This precision ensures geographic feature names flow naturally along topographic contours without breaking readability standards.
Maintaining Consistent Spacing Standards
Establish uniform spacing rules across all map elements to create professional visual cohesion throughout your cartographic project. Document your tracking values for headlines (0.03 em), body text (0.02 em), and annotations (0.01 em) to ensure consistency across multiple map sheets. Professional cartographers maintain spacing style guides that specify exact measurements for different zoom levels and print scales. This systematic approach prevents spacing inconsistencies that undermine your map’s professional appearance and user trust.
Optimize Text Placement and Orientation for Natural Flow
Strategic text placement creates intuitive reading patterns that mirror how users naturally scan geographic information. Your label positioning directly influences map comprehension and navigation efficiency.
Horizontal Alignment for Water Bodies and Flat Areas
Horizontal text placement works best for large water features like lakes, oceans, and broad river valleys. Position labels parallel to the map’s baseline to maintain consistent readability across different viewing angles. Center your text within the water body’s boundaries, ensuring adequate white space around all edges. Use tracking adjustments between 0.03-0.05 em for larger water features to improve letter spacing and visual balance.
Curved Text Following Geographic Contours
Curved text should follow the natural flow of geographic features like mountain ranges, coastlines, and river systems. Set your text path to match the feature’s dominant curve using 3-5 anchor points for smooth transitions. Maintain consistent character spacing along the entire curve to prevent crowding at tight bends. Position curved labels on the uphill side of elevation contours to enhance three-dimensional perception and depth understanding.
Angled Labels for Streets and Linear Features
Angled text placement improves readability for roads, railways, and infrastructure networks. Rotate street labels to match the roadway’s primary direction, keeping angles between 15-45 degrees from horizontal for optimal legibility. Position labels slightly offset from the linear feature rather than directly on top to prevent visual interference. Use consistent angular increments of 15 degrees to maintain visual harmony across your entire street labeling system.
Balance Typography Density to Avoid Visual Clutter
Effective typographic density management prevents your map from becoming an overwhelming wall of text that confuses rather than informs users.
Strategic White Space Around Important Labels
Preserve breathing room around critical geographic features by maintaining minimum 3-4 pixel buffers between text elements. You’ll prevent label collision while ensuring primary landmarks like cities and major roads receive visual priority. Buffer zones become especially crucial when displaying dense urban areas where multiple street names compete for space. Professional cartographers typically allocate 15-20% more white space than initially seems necessary to account for different viewing distances and screen resolutions.
Grouping Related Information Together
Cluster similar information types using consistent spacing patterns to create logical visual relationships across your map design. You should position related labels—such as neighborhood names, street addresses, and local landmarks—within proximity zones that reinforce their geographic connections. This approach reduces cognitive load by allowing users to process information in meaningful chunks rather than scanning randomly distributed text. Maintain 8-12 pixel spacing between grouped elements while using 20-24 pixel gaps to separate distinct information categories.
Eliminating Redundant or Unnecessary Text
Remove duplicate labels and excessive descriptive text that doesn’t enhance navigation or geographic understanding of your mapped area. You can eliminate state abbreviations when city names already provide sufficient context, or remove generic terms like “Road” and “Street” in dense urban environments where space is premium. Focus on essential wayfinding information that directly supports your map’s primary purpose. Every text element should serve a specific function—decorative or redundant labels create visual noise that diminishes overall map effectiveness.
Ensure Consistent Styling Across All Map Elements
Maintaining visual consistency across your entire map creates a professional appearance that builds user trust and navigation confidence. Your typographic choices should follow established patterns that unify all map components into a cohesive cartographic system.
Standardized Font Weights and Styles
Bold weights should be reserved exclusively for primary geographic features like countries, states, and major cities to maintain clear hierarchy. Regular weights work best for secondary elements such as smaller towns, neighborhoods, and street names. You’ll want to avoid mixing multiple font weights within the same category – stick to one weight per hierarchical level. Document your weight assignments in a style guide to ensure consistency across map updates and team collaborations.
Uniform Capitalization Rules
ALL CAPS should be used consistently for water features, administrative boundaries, and major geographic regions to establish visual distinction. Title Case works effectively for populated places, landmarks, and points of interest throughout your map. Sentence case is ideal for descriptive labels, annotations, and supplementary information that supports navigation. You’ll need to apply these rules systematically across all map elements to prevent confusion and maintain professional standards.
Cohesive Visual Language Throughout
Color coordination between typography and map symbols creates visual harmony that enhances user comprehension. Your text colors should complement the overall map palette while maintaining sufficient contrast for readability. Consistent spacing patterns between labels, uniform alignment principles, and standardized text treatments for similar features reinforce your map’s visual identity. You’ll achieve professional results by treating typography as an integral component of your cartographic design system rather than an afterthought.
Conclusion
Typography serves as the bridge between your geographic data and your audience’s understanding. When you implement these seven strategic approaches you’ll transform cluttered amateur maps into polished professional visualizations that communicate effectively.
Your success lies in treating typography as an integral design element rather than an afterthought. Each font choice spacing decision and color selection should work harmoniously to guide viewers through your geographic narrative without overwhelming them.
Remember that excellent map typography requires practice and refinement. Start with one or two techniques from this guide and gradually incorporate the others as you develop your cartographic skills. Your maps will become more readable engaging and trustworthy as you master these proven methods.
The difference between amateur and professional cartography often comes down to these typographic details. By prioritizing clarity consistency and visual hierarchy you’ll create maps that not only look professional but actually help users navigate and understand complex geographic information with confidence.
Frequently Asked Questions
What are the best font families for map design?
Professional cartographers primarily use three font categories: sans-serif fonts (Helvetica, Arial) for digital maps and small-scale text due to their clarity; serif fonts (Times New Roman, Georgia) for larger elements to establish hierarchy and traditional appeal; and script fonts sparingly for decorative purposes only, as they can hinder readability for navigation information.
How should I establish typography hierarchy on maps?
Use a three-tier sizing approach: large headlines (14-16 point) for major geographic features like countries and states; medium text (10-12 point) for secondary landmarks; and small labels (8-10 point) for minor details. Maintain consistent sizing and spacing throughout to prevent visual crowding and ensure clear information hierarchy.
What color contrast should I use for map typography?
Use high contrast combinations following WCAG accessibility standards: dark text on light backgrounds for essential labels, white text on dark backgrounds for nighttime themes. Apply subtle color variations for background elements to avoid competing with primary typography, and maintain consistent color coding across all map sections for predictable reading patterns.
Why is letter spacing important in map typography?
Proper letter spacing prevents text collision, especially in crowded urban areas. Use increased tracking (0.02-0.05 em) when necessary, fine-tune kerning for curved geographic features, and maintain consistent spacing standards. Document your tracking values and create style guides to ensure uniformity and professionalism across your entire mapping project.
How should I position text on maps for optimal readability?
Use horizontal alignment for large water bodies with adequate white space. For curved features, follow natural contours using anchor points for smooth transitions. Apply angled labels for streets and linear features with appropriate rotation angles. Always ensure text placement enhances navigation without creating visual interference or confusion.
How can I avoid visual clutter in map typography?
Maintain a minimum 3-4 pixel buffer between text elements to prevent label collision. Use strategic white space around important labels, group related information with consistent spacing patterns, and eliminate redundant text. Every text element should serve a specific function to maintain the map’s effectiveness and readability.
What styling standards should I follow for professional maps?
Standardize font weights: use bold for primary geographic features and regular for secondary elements. Apply uniform capitalization rules with ALL CAPS for major features and title case for populated places. Coordinate typography colors with map symbols to create cohesive visual language that enhances user comprehension and professional appearance.