7 Best Mixed Media Art Techniques
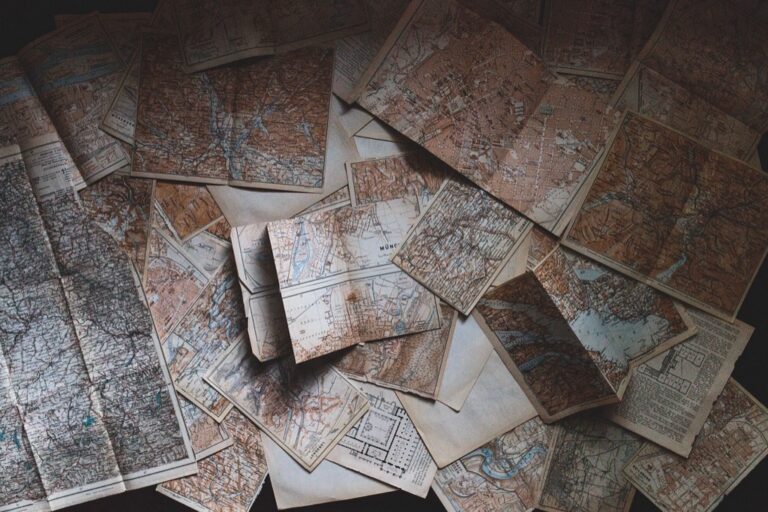
Traditional maps don’t have to be flat paper anymore. Mixed media cartography transforms static geographical data into dynamic visual experiences that engage multiple senses and tell richer stories about place and space.
Whether you’re a professional cartographer or creative enthusiast you’ll discover how combining digital technology with physical materials creates compelling map-based projects that stand out. These innovative approaches blend traditional mapmaking with modern techniques to produce work that’s both informative and artistically striking.
Disclosure: As an Amazon Associate, this site earns from qualifying purchases. Thank you!
Combine Digital Maps With Hand-Drawn Illustrations
Blending digital precision with hand-drawn artistry creates compelling cartographic works that showcase both technical accuracy and personal expression. This mixed media approach transforms sterile digital outputs into engaging visual narratives.
P.S. check out Udemy’s GIS, Mapping & Remote Sensing courses on sale here…
Add Personal Sketches to Geographic Boundaries
Enhance digital boundary lines by tracing them with pencil or charcoal sketches that add organic texture. You’ll create visual interest by varying line weights along coastlines rivers and political borders. Hand-drawn elements soften harsh digital edges while maintaining geographic accuracy. Sketch mountain ranges with crosshatching techniques or add stippled textures to forest boundaries. This approach works particularly well when you’re creating tourism maps or educational materials that need human warmth alongside precise geographic data.
Layer Watercolor Techniques Over Printed Maps
Apply watercolor washes directly onto high-quality printed base maps to create atmospheric depth and regional distinctions. You can use transparent watercolors to highlight elevation changes climate zones or cultural regions without obscuring underlying geographic details. Test paper compatibility first—heavier map stocks handle moisture better than standard printer paper. Build colors gradually with light washes allowing each layer to dry completely. This technique excels for creating wall-mounted displays or book illustrations where artistic appeal enhances geographic understanding.
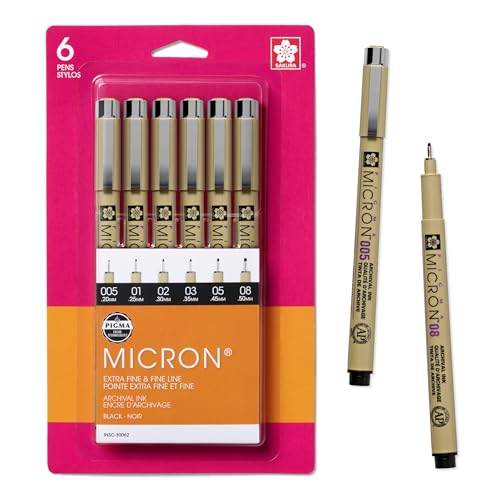
Incorporate Pen and Ink Details for Enhanced Texture
Add fine pen work over digital maps to emphasize specific features like building footprints vegetation patterns or topographic details. You’ll achieve professional results using archival ink pens with varying nib sizes from 0.1mm for fine details to 0.8mm for bold outlines. Crosshatching techniques work well for showing elevation changes while stippling creates effective texture for different land use areas. Focus pen details on key map elements rather than covering entire areas to maintain visual balance between digital and analog components.
Integrate Photography With Traditional Cartography
Photography transforms cartographic projects by adding authentic visual context to geographic data. This approach bridges the gap between abstract mapping conventions and real-world landscapes.
Overlay Aerial Photos on Hand-Drawn Base Maps
Combine your hand-drawn topographic foundations with georeferenced aerial imagery using transparency layers. Import your scanned base map into GIS software like ArcGIS or QGIS and overlay aerial photographs at 30-50% opacity. This technique preserves your artistic linework while adding photographic detail to terrain features. The method works particularly well for trail maps and environmental studies where you need both artistic appeal and accurate ground conditions.
Create Photo Collages Within Geographic Regions
Assemble representative photographs within defined map boundaries to showcase regional characteristics. Use vector polygons to mask photo collections within state borders administrative boundaries or watershed areas. Tools like Photoshop or GIMP allow precise clipping of image collections to geographic shapes. This approach effectively communicates cultural landscapes economic activities or ecological diversity across different zones while maintaining cartographic accuracy and visual hierarchy.
Use Historical Photographs as Map Background Elements
Layer archival photographs beneath contemporary map data to illustrate temporal changes in landscapes. Scan historical images at 300 DPI and georeference them using control points from unchanged landmarks like rock formations or permanent structures. Apply sepia tones or reduced opacity to prevent visual interference with current map symbology. This technique proves invaluable for heritage tourism maps urban development studies and environmental change documentation projects.
Mix Paper Textures and Materials for Dimensional Effects
Creating physical depth in your cartographic projects requires strategic layering of different materials to achieve tactile visual impact.
Layer Tissue Paper for Transparent Overlay Effects
Tissue paper creates subtle atmospheric layers that soften harsh map boundaries while maintaining underlying detail visibility. You’ll achieve the most effective results by applying tissue paper over water features using spray adhesive, allowing the base map’s contour lines to show through translucent layers. This technique works particularly well for depicting cloud cover, fog patterns, or seasonal snow coverage on topographic maps. Choose colors that complement your base palette—pale blues for water features or warm grays for elevation transitions.
Incorporate Fabric Pieces for Textural Contrast
Fabric integration adds authentic tactile qualities that represent different land use patterns and geographic textures in your mixed media cartography. You can apply small fabric swatches to represent agricultural areas using burlap for farmland or felt pieces for forest regions. Silk creates effective water surface textures while cotton batting simulates cloud formations or snow-covered peaks. Secure fabric pieces with acid-free adhesive to prevent long-term deterioration and maintain archival quality in your cartographic artwork.
Add Corrugated Cardboard for Topographical Relief
Corrugated cardboard provides cost-effective three-dimensional elevation representation that enhances your map’s topographical accuracy and visual appeal. You’ll create realistic mountain ranges by cutting cardboard strips following contour lines and layering them in elevation sequence. Sand the edges smooth before applying base colors to achieve professional results. This technique works exceptionally well for educational maps where tactile feedback helps viewers understand elevation changes and terrain complexity through both visual and physical engagement.
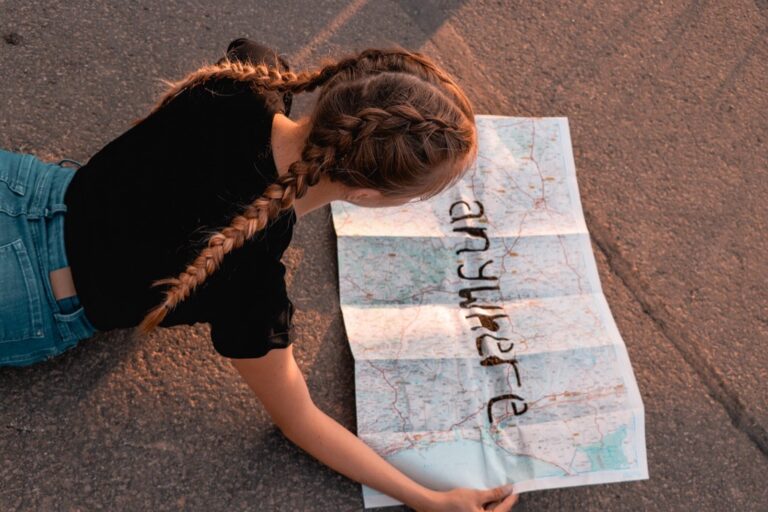
Blend Analog and Digital Typography Techniques
Typography choices dramatically impact how viewers interpret geographic information. Strategic combinations of handwritten and digital text create visual hierarchy while maintaining professional cartographic standards.
Combine Hand-Lettered Place Names With Digital Labels
Hand-lettered place names add authentic character to digital base maps while preserving GIS accuracy for coordinate systems. You’ll achieve optimal results by digitizing handwritten labels using high-resolution scanning at 600 DPI minimum. Use digital labels for data-driven elements like coordinates and elevation values while reserving hand lettering for cultural features. Adobe Illustrator‘s Live Trace function converts scanned handwriting into scalable vector text that integrates seamlessly with digital map layers.
Use Vintage Typography Stamps on Modern Maps
Vintage typography stamps create authentic historical aesthetics on contemporary cartographic projects without compromising modern accuracy standards. Apply alphabet stamps using archival ink to printed map sections before final digitization. Scanner resolution of 1200 DPI captures stamp texture details for professional reproduction quality. You can source authentic letterpress stamps from printing supply companies or create custom stamps using laser-cut rubber. This technique works exceptionally well for heritage tourism maps and historical interpretation projects.
Layer Digital Fonts Over Handwritten Annotations
Digital fonts provide consistent readability while handwritten annotations add personal context to geographic features. You’ll achieve professional results by using OpenType fonts with extensive character sets for international place names. Layer handwritten field notes as separate transparency levels in Adobe Photoshop or GIMP. Set handwritten elements to 60-70% opacity to maintain visibility without overwhelming digital text hierarchy. This approach proves valuable for field survey documentation and community mapping projects where local knowledge enhances official geographic data.
Incorporate Found Objects and Natural Materials
Adding physical elements from the natural world transforms flat cartographic representations into tactile, three-dimensional experiences that connect viewers to the actual landscapes you’re mapping.
Attach Small Stones to Represent Mountain Ranges
Collect small pebbles and stones from your mapping area to create authentic topographical relief. Secure these materials using strong adhesive or mounting putty directly onto your base map where elevation data indicates significant terrain features. This technique works particularly well for trail maps and geological surveys where understanding elevation changes is crucial for user navigation and safety.
Use Sand and Soil for Realistic Terrain Textures
Apply thin layers of actual sand or soil samples using spray adhesive to represent different geological formations and land cover types. Mix various soil colors to match regional characteristics – red clay for southeastern regions or black volcanic soil for specific geological areas. This approach enhances environmental education maps and creates compelling displays for visitor centers and interpretive installations.
Add Pressed Leaves and Flowers for Regional Flora
Incorporate dried botanical specimens that represent the actual vegetation found in your mapped regions. Press leaves and flowers between heavy books for two weeks before mounting them with archival glue to designated habitat zones on your cartographic base. This method proves especially effective for ecological field guides and botanical survey maps where species distribution visualization supports scientific documentation.
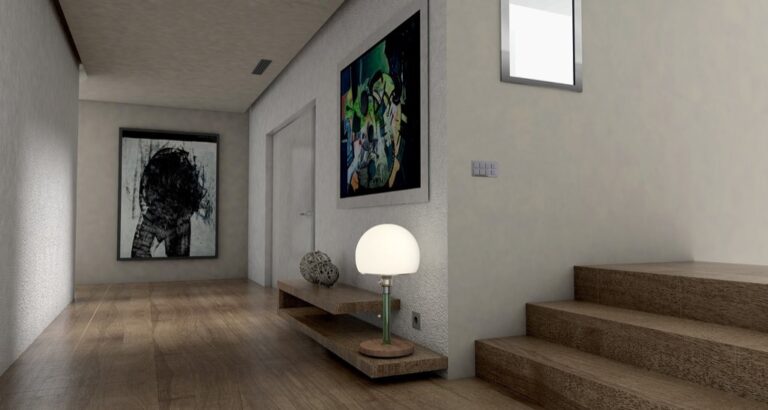
Experiment With Layered Transparency and Depth
Transparency effects transform flat cartographic displays into immersive visual experiences that reveal multiple data layers simultaneously. These techniques allow you to show complex geographic relationships without overwhelming your audience.
Stack Acetate Sheets for Multi-Level Information
Stack clear acetate sheets to create professional overlays that reveal different data themes on command. You’ll achieve precise registration by punching alignment holes and using metal posts or binding rings.
Layer demographic data on the first sheet, infrastructure networks on the second, and environmental boundaries on the third. This approach works exceptionally well for planning presentations where you need to demonstrate how different systems interact spatially. Print each layer using different color schemes to maintain visual clarity when sheets overlap.
Create Cut-Out Windows for Peek-Through Effects
Cut strategic windows in your top map layers to reveal hidden information beneath. You’ll create dramatic focal points by removing sections of paper or cardboard to expose underlying details.
Design rectangular cutouts over urban centers to show detailed street networks beneath regional maps. Use craft knives and metal rulers for clean edges, then layer contrasting materials like transparent film or textured paper behind the openings. This technique excels in tourism maps where you want to highlight specific neighborhoods while maintaining broader geographic context.
Build Three-Dimensional Pop-Up Map Elements
Construct pop-up elements using scored cardboard and precise folding techniques to add dramatic elevation changes. You’ll need to calculate fold angles carefully to ensure smooth operation when opening your map.
Create mountain ranges that rise when the map unfolds, or design urban skylines that pop up over city boundaries. Use lightweight materials like foam core for larger elements and reinforce connection points with fabric tape. Test your mechanisms repeatedly during construction to prevent jamming, and consider how the folded map will store when designing your pop-up architecture.
Utilize Mixed Media for Storytelling and Data Visualization
Mixed media cartography transforms complex data into compelling visual narratives that resonate with diverse audiences. You’ll discover how combining artistic elements with statistical information creates maps that both inform and inspire.
Combine Infographic Elements With Artistic Maps
Integrate bar charts and pie graphs directly onto watercolor map backgrounds to create visually striking data presentations. You can overlay demographic statistics using transparent geometric shapes while maintaining the artistic integrity of hand-painted geographic features. Position infographic elements strategically within regional boundaries, using color coordination between statistical graphics and underlying map artwork. This approach proves particularly effective for community development projects and census visualization work.
Layer Statistical Data Over Abstract Geographic Art
Apply semi-transparent data overlays onto stylized geographic representations to balance artistic expression with analytical precision. You’ll achieve optimal results by printing statistical heat maps on vellum paper and positioning them over acrylic-painted base maps. Use complementary color schemes where warm artistic tones support cool data visualizations, ensuring readability while preserving aesthetic appeal. This technique excels in environmental monitoring projects and socioeconomic mapping applications.
Integrate Timeline Elements Into Spatial Narratives
Embed chronological information directly into geographic layouts using ribbon-style timeline graphics that follow natural geographic features like rivers or coastlines. You can create temporal depth by layering historical photographs beneath current data points, connected with hand-drawn timeline arrows. Position date markers along geographic boundaries using mixed typography combining digital timestamps with handwritten annotations. This method proves invaluable for urban development documentation and historical preservation mapping projects.
Conclusion
These mixed media techniques transform your cartographic projects from simple reference tools into compelling visual narratives. You’ll discover that combining traditional materials with digital precision creates maps that engage viewers on multiple levels while maintaining professional accuracy.
Your exploration of these methods opens doors to unique storytelling opportunities that standard mapping simply can’t achieve. Whether you’re documenting community heritage or creating educational materials you’ll find these approaches add depth and authenticity to your work.
The versatility of mixed media cartography means you can adapt these techniques to match any project’s specific needs and aesthetic goals. Start experimenting with one or two methods that resonate with your vision and gradually expand your toolkit as you gain confidence with each approach.
Frequently Asked Questions
What is mixed media cartography?
Mixed media cartography is the evolution of traditional mapmaking that combines digital technology with physical materials to create dynamic, multi-sensory map experiences. It blends traditional cartographic techniques with modern tools, resulting in maps that are both informative and artistically appealing, engaging viewers through visual, tactile, and interactive elements.
How can I combine digital maps with hand-drawn illustrations?
You can enhance digital maps by adding personal sketches to geographic boundaries, layering watercolor washes over printed maps for atmospheric depth, and incorporating pen and ink details to emphasize specific features. This approach transforms sterile digital outputs into engaging visual narratives while maintaining cartographic accuracy.
What techniques work best for integrating photography with traditional maps?
Effective techniques include overlaying aerial photos on hand-drawn base maps using GIS software, creating photo collages within geographic regions to showcase cultural landscapes, and using historical photographs as background elements. These methods preserve artistic linework while adding authentic visual context to geographic data.
What materials can create dimensional effects in cartographic projects?
You can use tissue paper for transparent overlays, fabric pieces to represent different land uses, and corrugated cardboard for topographical relief. Natural materials like small stones for mountain ranges, sand and soil for terrain textures, and pressed leaves for regional flora add tactile, three-dimensional experiences.
How does typography impact mixed media cartography?
Typography creates visual hierarchy by blending handwritten and digital text. Effective techniques include combining hand-lettered place names with digital labels, using vintage typography stamps for historical aesthetics, and layering digital fonts over handwritten annotations. This enhances both authenticity and readability in cartographic projects.
What are advanced layering techniques for transparency and depth?
Advanced techniques include stacking clear acetate sheets to reveal multiple data layers, creating cut-out windows in top map layers for dramatic focal points, and constructing three-dimensional pop-up elements using scored cardboard. These methods display complex geographic relationships without overwhelming viewers while adding interactive features.
How can mixed media cartography enhance storytelling and data visualization?
Mixed media transforms complex data into compelling narratives by integrating infographic elements like bar charts onto watercolor backgrounds, layering statistical data over abstract geographic art using semi-transparent overlays, and embedding timeline elements that follow natural features to create temporal depth in spatial narratives.