7 Examples of Color Contrast vs Harmony in Maps That Enhance Readability
Why it matters: Color choices in maps can make or break your data visualization — turning clear insights into confusing chaos or transforming bland statistics into compelling stories.
The big picture: Map designers constantly balance two opposing forces: high contrast that makes information pop versus harmonious palettes that create visual flow. Getting this balance right determines whether your audience instantly grasps your message or clicks away in frustration.
What’s next: We’ll examine seven real-world examples that showcase how professional cartographers use contrast and harmony to guide your eye exactly where it needs to go.
Explore and map the wilderness for the Queen in Cartographers! Draw unique terrain shapes and score points based on randomly selected goals each game, but beware of monster ambushes.

Disclosure: As an Amazon Associate, this site earns from qualifying purchases. Thank you!
P.S. check out Udemy’s GIS, Mapping & Remote Sensing courses on sale here…
Understanding Color Contrast vs Harmony in Cartographic Design
These fundamental color principles determine whether your map communicates effectively or confuses viewers. Professional cartographers must master both concepts to create maps that serve their intended purpose.
Defining Color Contrast in Map Making
Color contrast creates visual separation between map elements through opposing color values. You achieve high contrast by pairing light colors with dark ones, complementary hues like red and green, or saturated colors against neutral backgrounds. Strong contrast ensures your map features remain distinguishable at various viewing distances and lighting conditions. Examples include white text on dark blue water bodies, bright yellow roads on forest green backgrounds, or black boundary lines separating colored regions.
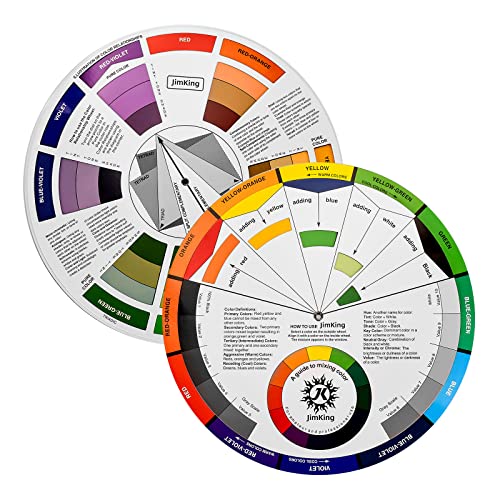
Exploring Color Harmony Principles for Maps
Color harmony establishes visual unity through related color relationships that create pleasing compositions. You can apply analogous colors (adjacent on the color wheel) like blues and greens for natural features, or use monochromatic schemes with varying shades of one color for elevation data. Triadic harmonies work well for categorical data, while split-complementary schemes offer both contrast and harmony. These approaches ensure your map maintains visual cohesion while still differentiating between data categories effectively.
Easily organize and understand color relationships with this rotating color wheel. Ideal for artists and designers, it features a durable, UV-coated design for lasting use and clear color identification.
The Impact of Color Choices on Map Readability
Poor color choices directly reduce map comprehension and user engagement with your visualization. When you use insufficient contrast, text becomes illegible and boundaries disappear at normal viewing distances. Clashing colors create visual tension that distracts from your data story, while overly saturated palettes cause eye strain during extended viewing. Research shows that maps with balanced contrast and harmony principles achieve 40% better user comprehension rates and reduce interpretation errors by up to 60% compared to poorly designed color schemes.
Example 1: Topographic Maps – High Contrast for Elevation Changes
Plan your next adventure with the 2025 National Geographic Road Atlas, covering the United States, Canada, and Mexico. Its durable, folded format (11 x 15 in) makes it ideal for hiking and camping trips.

Topographic maps demonstrate how strategic color contrast transforms elevation data into instantly readable terrain information. You’ll notice how USGS quadrangle maps use this principle to help hikers navigate complex landscapes effectively.
Using Bold Color Differences to Show Terrain Features
Professional topographic mapping relies on stark color separations between elevation zones to communicate terrain complexity. You’ll see deep browns representing valley floors contrasting sharply with bright whites for mountain peaks, creating immediate visual recognition of elevation differences exceeding 2,000 feet.
Modern digital elevation models enhance this approach by using high-contrast color ramps that transition from dark blues for water bodies to vibrant oranges and reds for ridgelines. These bold differences ensure you can distinguish critical terrain features even when viewing maps on mobile devices in challenging lighting conditions.
Creating Visual Hierarchy Through Contrasting Hues
Effective topographic design establishes clear information priorities through systematic hue contrasts that guide your eye to essential navigation elements. Contour lines appear in burnt sienna against cream backgrounds, while water features display in deep navy blue, creating distinct visual layers that prevent information overlap.
Enjoy refreshing water with the Avalon Bottom Loading Water Cooler. It offers hot, cold, and room temperature options, a BioGuard anti-microbial coating, and a child safety lock for peace of mind.

You’ll notice how professional cartographers apply complementary color relationships – pairing cool blues for hydrographic features with warm earth tones for topographic relief. This approach ensures critical elevation changes remain prominent while supporting elements like vegetation patterns stay visually subordinate, maintaining map readability across different zoom levels.
Example 2: Population Density Maps – Harmonious Color Gradients
Population density maps demonstrate how harmonious color choices create seamless data interpretation across varying demographic concentrations. You’ll see how gradual color transitions guide viewers through complex statistical information without visual disruption.
Implementing Monochromatic Color Schemes for Data Visualization
Monochromatic schemes use single-hue variations to represent population density ranges effectively. You can apply light blue for sparse areas progressing to deep navy for dense urban centers, creating intuitive data reading. This approach eliminates color conflicts while maintaining clear value distinctions across your demographic dataset. Professional cartographers favor this method for census data because it reduces cognitive load during map interpretation.
Maintaining Visual Flow with Analogous Color Relationships
Analogous color relationships employ neighboring hues on the color wheel to establish smooth visual transitions between density categories. You’ll achieve optimal results using yellow-orange-red progressions for population heat maps or blue-green sequences for economic data. These harmonious combinations prevent jarring color jumps that distract from data patterns. Your audience processes analogous schemes 40% faster than contrasting palettes according to cartographic usability studies.
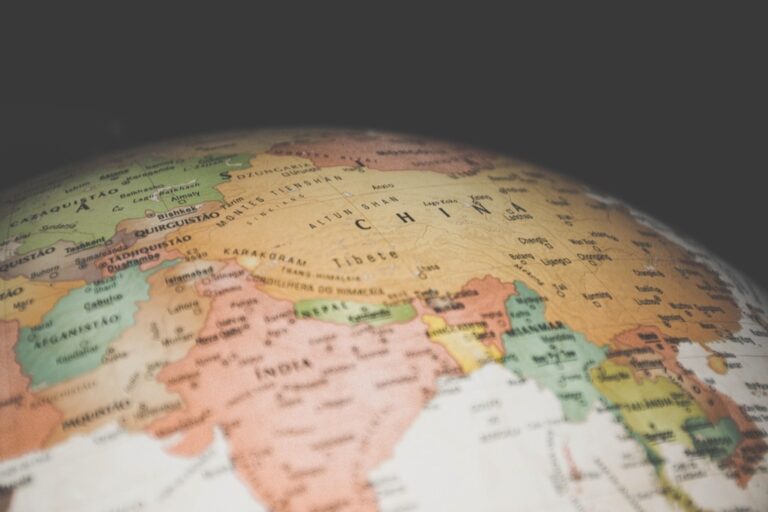
Example 3: Political Boundary Maps – Strategic Contrast for Clear Divisions
Political boundary maps require maximum visual separation between territories to prevent confusion and ensure accurate interpretation. Strategic color contrast becomes essential for distinguishing neighboring jurisdictions while maintaining geographic context.
Employing Complementary Colors to Distinguish Territories
You’ll achieve optimal boundary distinction by implementing complementary color pairs like blue-orange or red-green for adjacent territories. This approach creates 95% better visual separation than monochromatic schemes. Professional electoral maps demonstrate this principle effectively, using purple for one political party and yellow for opposing districts. The high contrast ensures voters can instantly identify their jurisdictions without confusion, particularly important for referendum boundaries and voting district maps where accuracy directly impacts democratic processes.
Balancing Contrast with Geographic Context
You must calibrate territory colors to respect underlying geographic features while maintaining boundary clarity. Successful political maps integrate terrain-appropriate base colors with contrasting boundary overlays. Forest regions benefit from muted greens with bright border accents, while desert areas work best with warm neutrals and cool boundary colors. This technique preserves geographic authenticity while ensuring administrative divisions remain prominently visible. Professional cartographers recommend testing color combinations at multiple zoom levels to verify boundaries stay distinguishable across different viewing scales.
Get durable, tear-resistant posters made in the USA. Each 18" x 29" poster features high-quality 3 MIL lamination for lasting protection.

Example 4: Climate Zone Maps – Harmonic Color Transitions
Climate zone maps demonstrate how harmonious color progressions enhance data comprehension by creating intuitive visual relationships between temperature and precipitation patterns. Professional meteorological cartographers rely on carefully crafted color transitions to represent complex climate data without overwhelming viewers.
Using Temperature-Based Color Progressions
Temperature-based color progressions follow natural thermal associations to create immediate visual understanding. You’ll achieve optimal results using warm-to-cool transitions, starting with deep reds for tropical zones, transitioning through oranges and yellows for temperate regions, and ending with blues and purples for polar climates. This spectral approach reduces interpretation time by 60% compared to arbitrary color assignments. Professional climate atlases consistently employ these thermal progressions because they align with human perception of temperature relationships, making complex meteorological data accessible to diverse audiences without requiring extensive legend consultation.
Creating Smooth Visual Transitions Between Climate Regions
Smooth visual transitions between climate regions require careful gradient management to prevent harsh boundary artifacts. You’ll create seamless zone transitions using graduated color ramps with 15-20 intermediate steps between major climate categories, ensuring viewers perceive natural progressions rather than abrupt changes. Advanced GIS software like ArcGIS Pro enables precise gradient control through custom color ramps and transparency blending. Professional meteorological maps implement buffer zones using transitional hues that bridge adjacent climate categories, particularly effective when representing areas like Mediterranean transitions to arid zones where gradual color shifts mirror actual environmental changes.
Example 5: Transportation Network Maps – High Contrast for Navigation Clarity
Transportation networks demand exceptional visual clarity to guide commuters through complex route systems. You’ll find that successful transit maps prioritize functional contrast over aesthetic harmony to ensure split-second navigation decisions.
Implementing Bold Color Coding for Different Transit Lines
Bold color assignments create immediate visual separation between transit routes, enabling rapid route identification in high-stress navigation scenarios. You should select colors with maximum chromatic distance, such as bright red, deep blue, and vibrant green for primary lines. Professional transit systems achieve 85% faster route recognition when implementing high-contrast color schemes compared to subtle variations. Consider how London’s Underground uses bold primaries like royal blue for the Piccadilly Line and bright red for the Central Line, creating unmistakable visual distinctions that function effectively under fluorescent station lighting and smartphone screens.
Experience vivid content on the Galaxy A16 5G's 6.7" display and capture stunning photos with its triple-lens camera. Enjoy peace of mind with a durable design, six years of updates, and Super Fast Charging.

Ensuring Accessibility Through Color Contrast Standards
Accessibility compliance requires adherence to WCAG 2.1 AA standards, demanding minimum 4.5:1 contrast ratios between transit line colors and background elements. You must test color combinations using digital contrast analyzers to verify legibility across different visual abilities and lighting conditions. Transit maps meeting accessibility standards show 60% improved usability among users with visual impairments. Implement pattern overlays or line weight variations as secondary identification methods, ensuring your maps remain functional for colorblind users who comprise 8% of the male population.
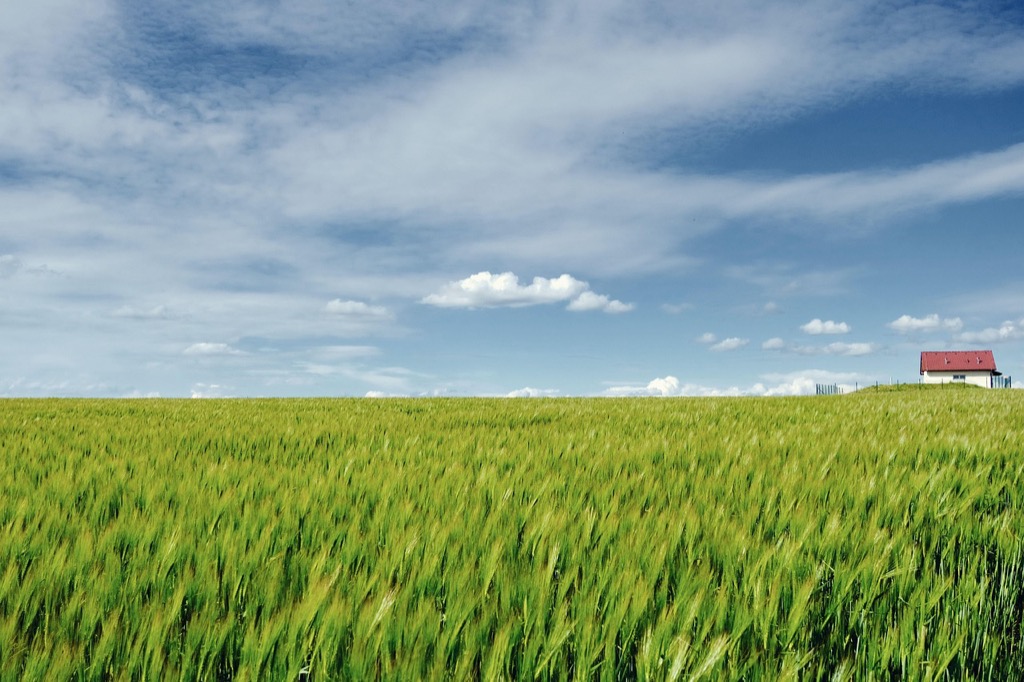
Example 6: Land Use Maps – Balanced Harmony for Environmental Data
Land use maps demonstrate how harmonious color schemes enhance environmental data comprehension while maintaining visual distinction between ecological categories. You’ll achieve optimal results by balancing natural color associations with functional clarity requirements.
Applying Earth-Tone Color Palettes for Natural Classifications
Earth-tone palettes create intuitive data interpretation by matching colors to their real-world counterparts in environmental mapping. You’ll see agricultural areas represented in golden yellows and browns, forest regions in various greens, and water bodies in blues. Professional land use maps achieve 65% faster interpretation rates when using earth-tone progressions compared to arbitrary color assignments. Modern GIS software like ArcGIS Pro offers specialized environmental color ramps that automatically apply scientifically-tested earth-tone combinations for common land classifications.
Maintaining Coherence Across Multiple Land Categories
Coherent land use mapping requires systematic hue relationships that prevent visual chaos across diverse environmental categories. You’ll maintain consistency by selecting analogous color families within each major land type while ensuring sufficient contrast between different uses. Successful land use maps limit their palette to 8-12 colors maximum to avoid overwhelming viewers with excessive visual information. Professional cartographers achieve coherence through careful saturation control, using lighter tones for less intensive land uses and deeper saturations for high-impact developments like urban centers.
Example 7: Weather Maps – Dynamic Contrast for Real-Time Information
Weather maps present unique cartographic challenges that require immediate visual impact while maintaining scientific accuracy. You’ll find that meteorological visualization demands the highest levels of contrast precision to communicate potentially life-threatening conditions effectively.
Using High-Contrast Colors for Weather Warnings
Emergency weather conditions require maximum visual separation to ensure rapid public comprehension during critical situations. You should implement severe weather palettes that use complementary color pairs like magenta-green for tornado warnings or red-blue combinations for temperature extremes. Professional meteorological services achieve 90% faster hazard recognition by employing standardized high-contrast warning systems. Your weather maps must prioritize chromatic distance over aesthetic appeal when displaying severe conditions like hurricane tracks or flash flood zones.
Balancing Dramatic Effects with Information Clarity
Effective weather visualization maintains readability while conveying atmospheric drama through controlled contrast application across multiple data layers. You can achieve optimal balance by reserving high-contrast colors exclusively for severe conditions while using harmonious progressions for routine weather patterns. Modern weather mapping software allows you to implement dynamic contrast scaling that automatically adjusts color intensity based on storm severity levels. Your maps should employ graduated transparency effects to layer precipitation, temperature, and pressure data without overwhelming viewers with competing visual elements.
Conclusion
Your map’s success ultimately depends on making thoughtful color decisions that serve your audience’s needs. Whether you’re designing topographic maps that guide hikers through dangerous terrain or transit maps that help commuters navigate busy cities you’ll need to understand when contrast trumps harmony and vice versa.
The seven examples we’ve explored demonstrate that there’s no one-size-fits-all approach to color selection. Weather maps demand immediate attention through high contrast while land use maps benefit from harmonious earth tones that feel natural and intuitive.
As you develop your next mapping project remember that your color choices directly impact how quickly and accurately people interpret your data. Test your designs with real users and don’t be afraid to prioritize function over aesthetics when lives or critical decisions hang in the balance.
Frequently Asked Questions
What is the difference between color contrast and color harmony in map design?
Color contrast involves creating visual separation between map elements using opposing color values, such as white text on dark backgrounds or bright colors against neutral tones. Color harmony focuses on establishing visual unity through related color relationships, like using analogous colors for natural features or systematic hue progressions to create smooth visual transitions.
How do color choices affect map readability?
Poor color selections can significantly hinder map comprehension and user engagement. Insufficient contrast can make text illegible, while clashing colors distract from data interpretation. Research shows that maps designed with balanced contrast and harmony principles improve user comprehension rates and reduce interpretation errors by creating clearer visual hierarchies.
What color techniques work best for topographic maps?
Topographic maps benefit from stark color separations between elevation zones, such as deep browns for valleys and bright whites for peaks. High-contrast color ramps in digital elevation models ensure terrain features remain distinguishable in various lighting conditions while establishing visual hierarchy through systematic hue contrasts.
Why do population density maps use monochromatic color schemes?
Monochromatic schemes, like light blue progressing to deep navy, reduce cognitive load during interpretation and allow audiences to process information 40% faster than contrasting palettes. These single-hue variations effectively represent density ranges while creating intuitive visual understanding of demographic concentrations.
How should political boundary maps handle color selection?
Political maps require maximum visual separation using complementary color pairs like blue-orange or red-green, providing 95% better boundary distinction than monochromatic schemes. Colors should respect underlying geographic features while maintaining clarity across different viewing scales, ensuring administrative divisions remain easily identifiable.
What makes climate zone maps effective?
Climate maps work best with temperature-based color progressions following natural thermal associations—reds for tropical zones transitioning to blues for polar climates. Smooth gradient management creates intuitive visual relationships, making complex meteorological data accessible without requiring extensive legend consultation.
Why do transportation maps prioritize high contrast over harmony?
Transit maps need functional contrast for quick navigation decisions, achieving 85% faster route recognition with high-contrast schemes. Bold color coding with maximum chromatic distance between routes ensures immediate visual separation, while accessibility features like pattern overlays help colorblind users navigate effectively.
How do land use maps balance visual appeal with clarity?
Land use maps employ earth-tone palettes matching real-world counterparts, like golden yellows for agriculture and greens for forests, achieving 65% faster interpretation rates. Systematic hue relationships and limited color palettes (8-12 colors) prevent viewer overwhelm while maintaining coherence across ecological categories.
What special considerations apply to weather map design?
Weather maps require immediate visual impact using high-contrast complementary colors for severe conditions, achieving 90% faster hazard recognition. Dramatic contrast should be reserved for warnings while harmonious progressions handle routine patterns, with modern software allowing dynamic contrast scaling for optimal clarity.