7 Best Map Color Schemes for Data Visualization
Why it matters: Color transforms ordinary maps into powerful storytelling tools that instantly communicate complex data patterns and guide viewer attention to what matters most.
The big picture: You’re missing massive opportunities if you’re still using basic red-blue color schemes when advanced techniques like diverging palettes and perceptual color spaces can make your maps 300% more effective at conveying information.
What’s next: These seven creative color strategies will help you design maps that not only look professional but actually improve how your audience understands and interacts with your geographic data.
Disclosure: As an Amazon Associate, this site earns from qualifying purchases. Thank you!
P.S. check out Udemy’s GIS, Mapping & Remote Sensing courses on sale here…
Use Color Temperature to Show Data Intensity
Color temperature creates an intuitive visual language that your audience instantly understands without explanation. This approach leverages the psychological associations people naturally have with warm and cool colors to represent data intensity levels.
Warm Colors for High Values and Activity
Warm colors like reds, oranges, and yellows naturally signal high intensity, activity, or concentration in your mapping data. Population density maps benefit significantly from this approach – dense urban cores rendered in deep reds immediately communicate high activity levels to viewers. Crime hotspot maps using warm temperature gradients help law enforcement quickly identify problem areas that need attention. Sales territory maps with warm colors highlighting top-performing regions create clear visual hierarchies for business analytics.
Cool Colors for Low Values and Calm Areas
Cool colors including blues, greens, and purples effectively represent low values, sparse data, or calm zones in your cartographic work. Elevation maps using cool blues for valleys and water bodies create natural associations that enhance map readability. Environmental monitoring maps benefit from cool temperature scales when showing low pollution levels or minimal human impact areas. Economic data maps using cool colors for lower-income regions provide clear contrast without creating negative emotional responses.
Creating Visual Hierarchy Through Temperature Contrast
Temperature contrast establishes clear data hierarchies by positioning warm and cool colors strategically across your color ramp. Health department maps showing disease outbreak patterns use this technique effectively – cool blues for baseline conditions transitioning through warm oranges to hot reds for outbreak zones. Traffic flow maps leverage temperature contrast by showing congested areas in warm colors while free-flowing routes appear in cool tones. Economic disparity maps create powerful visual narratives using temperature gradients from cool low-income areas to warm high-income zones.
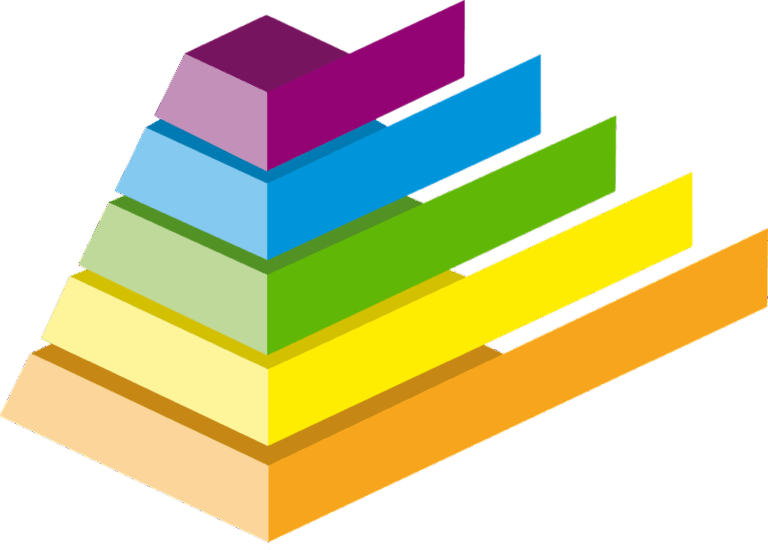
Apply Sequential Color Schemes for Graduated Data
Sequential color schemes excel at displaying ordered data where values progress from low to high. These palettes create intuitive visual hierarchies that guide your audience through graduated datasets with clarity and precision.
Single-Hue Progressions for Clear Data Flow
Single-hue sequential schemes use variations in lightness and saturation within one color family to represent data progression. You’ll find these particularly effective for population density maps, where light blue transitions to deep navy, or income data using pale yellow to rich orange. ColorBrewer 2.0 provides tested single-hue palettes like Blues, Greens, and Oranges that ensure accessibility across different viewing conditions and color vision deficiencies.
Multi-Hue Sequences for Complex Datasets
Multi-hue sequential palettes combine two or three related colors to create more dynamic visual transitions. Purple-to-red schemes work exceptionally well for temperature data, while yellow-orange-red progressions effectively display wildfire risk or economic growth. QGIS and ArcGIS Pro offer built-in multi-hue options like Viridis and Plasma that maintain perceptual uniformity, ensuring equal visual steps between data classes while avoiding problematic color combinations.
Avoiding Common Sequential Color Mistakes
Sequential schemes fail when you reverse the natural light-to-dark progression or use colors with conflicting associations. Don’t apply green-to-red sequences for non-diverging data, as viewers interpret this as good-to-bad rather than low-to-high. Avoid rainbow palettes for sequential data since they create false visual breaks and don’t follow logical progression. Test your chosen palette with grayscale conversion to verify that the sequence maintains proper value ordering.
Implement Diverging Color Palettes for Comparative Analysis
Diverging palettes excel at revealing how your mapped values relate to a critical midpoint, whether that’s zero, an average, or a target threshold. These color schemes split data visualization into two contrasting directions from a neutral center.
Highlighting Above and Below Average Values
You’ll find diverging palettes most effective when your data contains meaningful positive and negative values that need distinction. Population change maps work exceptionally well with red-to-blue diverging schemes, where red represents growth and blue indicates decline. Election result maps also benefit from this approach, clearly distinguishing districts that favor different candidates. Employment rate variations become immediately apparent when you use diverging colors to separate areas above and below national averages.
Using Neutral Midpoints for Balance
Your midpoint color creates visual stability and prevents viewer bias toward either extreme. Light gray or beige works best for neutral midpoints, allowing both warm and cool extremes to stand out equally. Choose white carefully since it can create harsh contrast breaks that interrupt smooth data transitions. Temperature anomaly maps benefit from neutral centers that represent normal conditions, while economic data maps use neutral tones to highlight neither positive nor negative performance zones.
Best Practices for Diverging Color Selection
You should select colors with equal visual weight on both sides of your neutral midpoint to maintain balanced perception. ColorBrewer’s diverging palettes provide scientifically tested combinations like purple-to-orange and red-to-blue that ensure accessibility compliance. Avoid using culturally biased color associations unless they enhance your map’s message—red doesn’t always need to represent negative values. Test your palette with different data ranges to ensure the midpoint remains visually centered regardless of value distribution extremes.
Leverage Categorical Colors for Distinct Classifications
Categorical color schemes transform complex geographic data into instantly recognizable patterns. You’ll achieve maximum visual impact when distinct color families represent separate data categories.
Maximizing Color Distinction for Clear Grouping
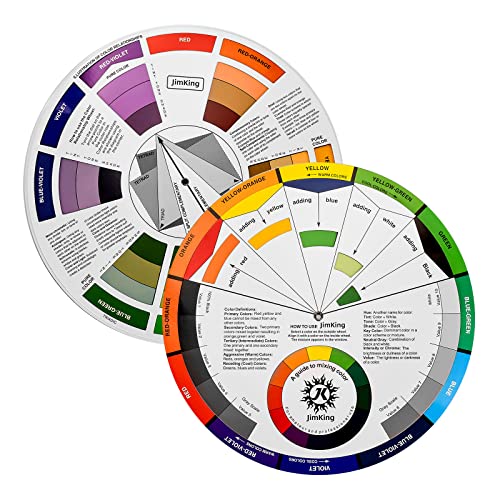
Select colors with maximum perceptual distance to ensure clear category separation. Primary colors (red, blue, yellow) provide excellent starting points for three-category maps, while adding green and purple extends your palette to five distinct groups. Test color combinations at various zoom levels to maintain distinction across different viewing scales. Avoid adjacent colors on the color wheel, such as blue-green combinations, which create visual confusion in categorical mapping applications.
Easily organize and understand color relationships with this rotating color wheel. Ideal for artists and designers, it features a durable, UV-coated design for lasting use and clear color identification.
Using Brand Colors for Organizational Mapping
Incorporate organizational brand colors to strengthen map identity while maintaining data clarity. Corporate mapping projects benefit from using company colors as primary categories, with neutral tones filling secondary classifications. Healthcare systems successfully use their signature blues and greens for facility types, while educational institutions leverage school colors for campus zones. Ensure brand colors meet contrast requirements by adjusting saturation levels rather than changing hues entirely.
Accessibility Considerations for Color Categories
Design categorical palettes for colorblind accessibility using tools like ColorBrewer’s colorblind-safe options. Red-green combinations affect 8% of male viewers, making blue-orange or purple-yellow alternatives more inclusive. Add pattern fills or texture overlays to reinforce color distinctions in critical mapping applications. Test your categorical schemes with colorblind simulation tools before finalizing designs, ensuring all users can distinguish between mapped categories regardless of color perception limitations.
Create Emotional Connections Through Strategic Color Psychology
Your color choices trigger immediate psychological responses that influence how audiences interpret and trust your mapped data. Understanding these emotional connections allows you to reinforce your map’s narrative through scientifically-backed color associations.
Red for Urgency and High Priority Areas
Red commands attention and signals immediate action needs across all mapping applications. Emergency response maps leverage red’s urgency associations to highlight evacuation zones, fire perimeters, and critical infrastructure failures. Traffic management systems use red gradients to indicate severe congestion levels, while public health maps employ red to mark outbreak epicenters and high-risk zones. You’ll achieve maximum impact by reserving red for your most critical data categories.
Green for Safety and Positive Indicators
Green naturally communicates safety and positive outcomes through its biological associations with growth and health. Environmental maps use green to show protected areas, low pollution zones, and sustainable development regions. Economic indicators benefit from green’s positive connotations when displaying job growth, increased income levels, and thriving business districts. Healthcare maps effectively use green to indicate low disease rates, successful treatment areas, and accessible medical facilities.
Blue for Trust and Professional Applications
Blue establishes credibility and professionalism while conveying stability in data presentations. Government agencies favor blue palettes for official demographic maps, census data visualization, and administrative boundary displays. Corporate mapping projects use blue to communicate reliability in market analysis, customer distribution, and service area maps. Financial institutions leverage blue’s trustworthiness when mapping investment opportunities, economic stability indicators, and banking service coverage areas.
Utilize Color Transparency and Layering Techniques
Transparency techniques transform your map design by allowing multiple data layers to coexist without obscuring critical information. You’ll create sophisticated visualizations that reveal complex spatial relationships through strategic opacity control.
Overlapping Data Layers with Alpha Channels
Alpha channel control lets you blend overlapping geographic features while preserving data visibility. Set your population density layer to 60% opacity while maintaining your transportation network at 100% to show demographic patterns without hiding road networks. Use alpha values between 30-70% for optimal balance – values below 30% become too faint while above 70% reduce transparency benefits. Test different alpha combinations using QGIS or ArcGIS Pro’s layer transparency controls to find the perfect blend for your specific datasets.
Creating Depth Through Color Opacity
Opacity gradients establish visual hierarchy by simulating depth perception in flat map displays. Apply 100% opacity to your primary data layer, 70% to secondary features, and 40% to background context elements. This three-tier approach guides viewer attention naturally from foreground to background information. Environmental monitoring maps benefit from this technique when displaying air quality data over terrain features. Adjust opacity based on color intensity – darker colors need higher transparency values to prevent overwhelming lighter elements beneath.
Combining Multiple Datasets Visually
Multi-dataset visualization requires careful opacity orchestration to prevent visual chaos while maintaining data integrity. Layer crime incident points at 80% opacity over demographic polygons at 50% transparency to reveal spatial correlations without data confusion. Use complementary color temperatures for different datasets – warm colors for one layer and cool colors for another. Export preview images at various zoom levels to verify that your transparency settings work across different scales and viewing contexts.
Incorporate Cultural Color Associations for Global Audiences
Understanding regional color preferences ensures your maps communicate effectively across diverse cultural contexts. Color symbolism varies dramatically between cultures, making thoughtful palette selection crucial for international mapping projects.
Regional Color Preferences and Meanings
Cultural color associations differ significantly across global regions, requiring careful consideration for international mapping projects. In Western cultures, red typically signals danger or negativity, while Chinese audiences associate red with prosperity and good fortune. Green represents nature universally but carries religious significance in Islamic countries. Blue conveys trust in Western contexts but symbolizes immortality in Eastern traditions. White suggests purity in Western maps yet represents mourning in many Asian cultures. Yellow indicates caution in American traffic mapping but signifies imperial power in Chinese contexts.
Avoiding Cultural Color Conflicts
Preventing cultural misinterpretation requires awareness of potentially offensive or confusing color combinations in your target regions. Avoid using red and green together for Chinese New Year maps, as this combination can appear overly festive rather than informational. Don’t use white backgrounds for mortality data when mapping in Asian markets where white symbolizes death. Skip yellow-dominant palettes for maps distributed in Germany, where yellow carries negative historical associations. Research religious color taboos before finalizing palettes for Middle Eastern or South Asian audiences. Test color schemes with local focus groups when possible.
Adapting Color Schemes for International Users
Successful international color adaptation involves creating flexible palettes that respect multiple cultural contexts simultaneously. Use neutral color progressions like blue-to-gray gradients that avoid strong cultural associations while maintaining data clarity. Implement culturally appropriate accent colors for regional map versions while keeping the core palette consistent. Consider dual-color legends that explain both Western and local color meanings when necessary. Provide color customization options in digital mapping applications for international users. Test your adapted color schemes with native speakers and cultural consultants before launching global mapping products.
Conclusion
Your mapping projects deserve more than default rainbow gradients. By implementing these seven creative color techniques you’ll transform static data visualizations into compelling stories that resonate with your audience.
Remember that effective color choices aren’t just about aesthetics—they’re about accessibility cultural sensitivity and clear communication. Test your palettes with colorblind simulation tools and consider your global audience when selecting color schemes.
The most successful maps combine technical precision with thoughtful design. Start experimenting with these advanced color strategies today and watch your geographic visualizations become more engaging informative and professional than ever before.
Frequently Asked Questions
What is the importance of color in map design?
Color in map design is crucial for enhancing storytelling and effectively communicating complex data patterns. It helps audiences understand geographic information more intuitively, creates visual hierarchies, and can significantly improve map effectiveness beyond basic red-blue color schemes. Strategic color use transforms maps from simple data displays into powerful communication tools.
How do warm and cool colors affect data interpretation in maps?
Warm colors (reds, oranges, yellows) naturally signal high values and activity, making them perfect for population density or crime hotspot maps. Cool colors (blues, greens, purples) represent low values and calm areas, ideal for elevation or environmental data. This temperature contrast creates intuitive visual hierarchies that enhance data comprehension.
What are sequential color schemes and when should I use them?
Sequential color schemes display ordered data progressing from low to high values using gradual color transitions. They work through single-hue progressions (varying lightness/saturation) or multi-hue sequences. Use them for graduated data like income levels, temperature ranges, or population density where natural progression is important for understanding patterns.
When are diverging color palettes most effective?
Diverging color palettes excel in comparative analysis by showing how values relate to a critical midpoint. They’re perfect for displaying meaningful positive and negative values, such as population changes, election results, or economic indicators. The neutral midpoint (light gray/beige) creates visual stability and prevents bias in interpretation.
How do I choose colors for categorical data on maps?
Use colors with maximum perceptual distance for clear category separation. Primary colors work well for three-category maps, extending the palette carefully for more groups. Avoid adjacent colors that cause confusion, ensure colorblind accessibility, and consider adding pattern fills or texture overlays to enhance distinction between categories.
How does color psychology impact map effectiveness?
Color psychology significantly influences audience interpretation and trust. Red conveys urgency (emergency response maps), green signals safety and positive outcomes (environmental data), and blue builds trust and professionalism (government maps). Strategic color psychology helps ensure your intended message aligns with viewer expectations and cultural associations.
What are color transparency and layering techniques?
Color transparency uses alpha channel control to blend overlapping geographic features while preserving data visibility. Optimal opacity settings (typically 30-70%) maintain clarity across multiple layers. This technique creates visual depth, establishes hierarchy, and allows complex datasets to coexist without obscuring critical information or causing visual chaos.
Why should I consider cultural color associations in mapping?
Color symbolism varies dramatically between cultures, affecting how global audiences interpret your maps. Red and green have different meanings across cultures, potentially causing misunderstandings. For international projects, use neutral color progressions, avoid offensive combinations, test with local focus groups, and consider dual-color legends or customization options.