5 Best Gradient Techniques for Topographical Mapping
Why it matters: Traditional topographical maps often rely on standard color schemes that can make elevation changes difficult to interpret, but custom gradients transform complex terrain data into visually striking and highly readable visualizations.
Explore Texas with this comprehensive atlas. It features detailed topographic maps, back roads, and points of interest for outdoor enthusiasts.

The big picture: You’re not limited to boring greens and browns when creating topographical maps – innovative gradient techniques can highlight specific elevation ranges, emphasize geological features, and make your terrain data more accessible to diverse audiences.
What’s next: These five custom gradient approaches will revolutionize how you present elevation data, whether you’re mapping mountain ranges, urban landscapes, or underwater terrain for scientific research or public engagement.
Disclosure: As an Amazon Associate, this site earns from qualifying purchases. Thank you!
P.S. check out Udemy’s GIS, Mapping & Remote Sensing courses on sale here…
Elevation-Based Color Gradients for Enhanced Terrain Visualization
Elevation-based color gradients form the foundation of effective topographical mapping by creating intuitive visual connections between color and height. These gradient systems help you communicate elevation data clearly while maintaining cartographic standards that users expect.
Achieve a flawless, even complexion with e.l.f. Flawless Satin Foundation. This lightweight, vegan formula provides medium coverage and a semi-matte finish for all-day wear, while hydrating your skin with glycerin.

Traditional Green to Brown Progression
Green to brown gradients represent the most widely recognized elevation mapping system, transitioning from sea-level greens through intermediate yellows to highland browns. You’ll achieve optimal results by setting your green values at 0-500 feet elevation, transitioning to yellow-brown at 1,000-3,000 feet, and deep browns above 5,000 feet. This progression matches natural vegetation patterns and provides immediate elevation recognition for most map users.
Blue to White Alpine Mapping
Blue to white gradients excel in high-altitude terrain visualization, starting with deep blues at treeline elevations around 10,000 feet and progressing to pure white at peak elevations. You can enhance this system by incorporating subtle gray transitions at mid-alpine zones between 12,000-14,000 feet. This gradient effectively communicates snow coverage patterns and helps mountaineers identify technical climbing zones through color intensity variations.
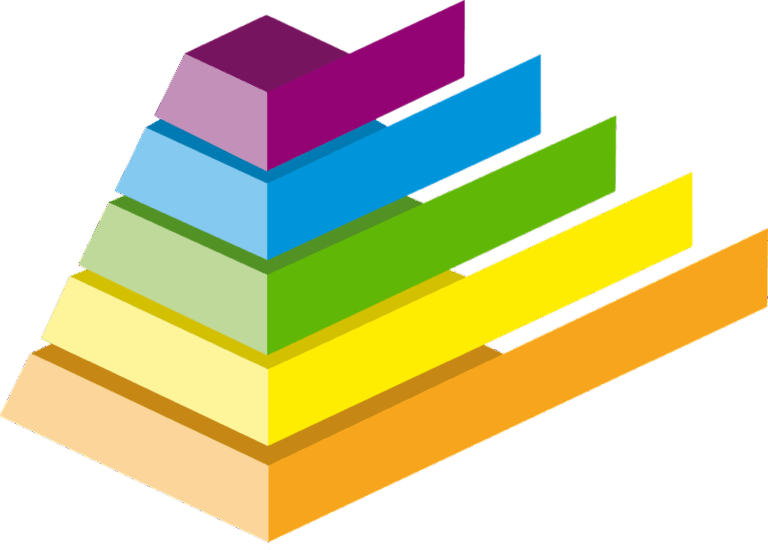
Multi-Hue Elevation Scaling
Multi-hue scaling systems utilize the full visible spectrum to maximize elevation differentiation across complex terrain. You’ll typically progress from deep purples and blues at lowest elevations through greens, yellows, oranges, and reds at highest points. This approach works best when you’re mapping areas with extreme elevation variance exceeding 8,000 feet, allowing precise elevation identification through distinct color bands every 500-1,000 feet.
Hypsometric Tinting Techniques for Professional Cartography
Professional hypsometric tinting extends beyond basic elevation gradients by incorporating specialized color systems that respond to specific terrain characteristics and user requirements.
Classic Bathymetric Blue Schemes
You’ll achieve optimal underwater terrain visualization through International Hydrographic Organization (IHO) standard blue progressions. Deep ocean trenches require navy blue (#003366) transitioning through medium blues to cyan (#66CCFF) at shallow depths. Your bathymetric accuracy improves when you apply logarithmic scaling rather than linear intervals, particularly for abyssal plains exceeding 4,000 meters depth. Professional marine charts typically use 6-8 blue gradations with white reserved for exposed land masses and tidal zones.
Learn to navigate confidently with this guide to nautical charts! Understand both electronic and paper charts, including a complete reference to Chart #1 symbols and abbreviations.

Desert Terrain Warm Gradients
You’ll capture arid landscape complexity using earth-tone progressions from deep amber (#CC6600) through burnt orange to pale yellow (#FFFF99). Sand dune elevation changes become clearly visible when you incorporate red undertones for higher elevations and yellow highlights for valley floors. Your desert mapping benefits from increased saturation at mid-elevations where most human activity occurs. Consider adding subtle purple shadows (#663366) for extremely low elevations like salt flats or playas.
Arctic Landscape Cool Palettes
You’ll represent polar terrain effectively through blue-white-gray combinations that reflect actual ice and snow conditions. Glacial elevation mapping requires pale blue (#E6F3FF) for ice-covered areas transitioning to stark white for mountain peaks above 2,000 meters. Your arctic charts should incorporate gray undertones (#CCCCCC) for exposed rock and permafrost zones. Professional polar maps often use cyan highlights (#00FFFF) to distinguish between permanent ice sheets and seasonal snow coverage.
Slope Analysis Gradients for Detailed Topographical Studies
Slope analysis gradients transform angular measurements into visual narratives that reveal terrain stability and accessibility patterns. These specialized color schemes enable you to communicate complex gradient data through intuitive visual systems.
Gentle to Steep Incline Color Coding
Progressive slope gradients use green-to-red transitions to represent incline severity across your terrain model. You’ll assign gentle slopes (0-15%) cool greens while steep inclines (45%+) display warning reds. Mid-range slopes utilize yellows and oranges for 15-45% grades. This classification system helps hikers assess trail difficulty and engineers evaluate construction feasibility through immediate visual recognition of slope characteristics.
Aspect-Based Directional Gradients
Directional slope analysis employs compass-based color wheels to show which direction each slope faces across your mapped area. You’ll use warm colors (reds/oranges) for south-facing slopes and cool blues for north-facing aspects. East-facing slopes display yellows while west-facing areas show purples. This gradient system reveals microclimatic zones, snow retention patterns, and vegetation distribution factors critical for ecological studies and agricultural planning.
Risk Assessment Color Schemes
Hazard-specific gradients combine slope angle with geological factors to create comprehensive risk visualization systems for your safety assessments. You’ll use graduated red intensities to mark landslide-prone areas while blue gradients indicate flood-risk zones. Avalanche corridors display purple-to-white transitions based on angle and exposure factors. These specialized color schemes help emergency planners and outdoor recreation managers identify dangerous terrain features requiring additional safety protocols.
Geological Feature Highlighting Through Custom Gradients
Custom gradients reveal distinct geological features that standard elevation mapping can’t effectively communicate. You’ll transform raw geological data into visually compelling maps that instantly communicate subsurface composition and structural characteristics.
Rock Formation Type Classifications
Igneous rock classifications utilize high-contrast color schemes ranging from deep reds for granite to bright oranges for volcanic basalt. You’ll assign sedimentary formations cooler blues and grays to represent limestone and sandstone layers effectively. Metamorphic structures require distinct purple-to-green gradients that highlight schist and gneiss formations. This classification system enables geologists to identify rock boundaries and structural relationships across complex terrain features.
Soil Composition Mapping Colors
Agricultural soil mapping employs brown-to-yellow gradients that correlate directly with organic matter content and fertility levels. You’ll use darker browns for humus-rich topsoil and lighter tans for sandy or clay-dominant substrates. Urban soil contamination requires red-orange warning gradients that indicate industrial pollutants or heavy metal concentrations. These color schemes help environmental engineers assess soil quality and agricultural potential across different geographic regions.
Mineral Deposit Identification Schemes
Metallic ore deposits utilize metallic color gradients matching their physical appearance—copper deposits in bronze tones and gold veins in yellow-amber schemes. You’ll represent rare earth elements through purple-violet gradients that distinguish them from common mineral formations. Coal seams require black-to-gray gradients with high contrast boundaries to show extraction zones clearly. These specialized color schemes enable mining engineers and geologists to visualize resource distribution and plan extraction operations efficiently.
Weather and Climate Integration Gradients for Environmental Mapping
Weather and climate data transforms traditional topographical mapping into dynamic environmental storytelling tools. You’ll combine elevation data with meteorological information to create comprehensive visualizations that reveal terrain-climate relationships.
Temperature Overlay Combinations
Temperature gradient overlays use thermal color schemes that blend seamlessly with elevation data to show microclimatic variations. You’ll apply warm red-orange gradients for heat islands and cool blue-purple schemes for cold zones, creating dual-layer visualizations that highlight temperature differentials across elevation changes. Professional mapping software like ArcGIS Pro enables opacity controls that maintain topographical detail while displaying thermal patterns, particularly effective for urban heat mapping and agricultural zone identification.
Precipitation Pattern Visualizations
Precipitation mapping employs graduated blue-to-white gradients that intensify with rainfall amounts, creating intuitive moisture distribution patterns. You’ll use logarithmic scaling for extreme precipitation events where standard linear gradients fail to show subtle variations in moderate rainfall zones. Combining precipitation data with elevation creates orographic effect visualizations that demonstrate how mountain ranges influence weather patterns, essential for watershed management and flood risk assessment mapping projects.
Seasonal Variation Color Schemes
Seasonal gradient systems utilize four-color progressive schemes that represent quarterly climate changes across topographical features. You’ll implement green-yellow-orange-brown transitions for vegetation cycles, while blue-white-gray progressions show snow coverage duration at different elevations. Time-series animation capabilities in modern GIS platforms allow dynamic seasonal transitions, revealing how climate patterns shift across terrain throughout the year, particularly valuable for forestry planning and wildlife habitat mapping applications.
Conclusion
These five custom gradient approaches will transform your topographical mapping from basic elevation displays into powerful visual communication tools. You’ll find that each technique serves specific purposes – whether you’re highlighting geological features analyzing slope stability or integrating climate data into your terrain visualization.
The key to successful implementation lies in matching your gradient choice to your map’s intended audience and purpose. Professional surveyors need different visual cues than recreational hikers and your color schemes should reflect these distinct requirements.
Start experimenting with these techniques on your next mapping project. You’ll discover that custom gradients not only improve data interpretation but also make your topographical maps more engaging and accessible to diverse users across various industries and applications.
Frequently Asked Questions
What are the main limitations of traditional topographical maps?
Traditional topographical maps use standard color schemes that can obscure important elevation changes and make it difficult to interpret terrain features. These conventional approaches often fail to highlight specific geological characteristics, slope variations, and terrain hazards that are crucial for various professional applications and outdoor activities.
How do elevation-based color gradients improve map readability?
Elevation-based color gradients create intuitive visual connections between color and height, making maps easier to understand at a glance. For example, green-to-brown gradients align with natural vegetation patterns, while blue-to-white gradients effectively communicate snow coverage in high-altitude areas, allowing users to quickly identify elevation zones.
What is hypsometric tinting and how does it work?
Hypsometric tinting is a professional mapping technique that uses specialized color systems tailored to specific terrain characteristics. It goes beyond basic elevation gradients by incorporating bathymetric blue schemes for underwater features, warm earth tones for desert terrains, and cool blue-white-gray palettes for arctic landscapes.
How do slope analysis gradients help assess terrain safety?
Slope analysis gradients transform angular measurements into visual narratives using color transitions like green-to-red to represent incline severity. This helps hikers assess trail difficulty, engineers evaluate construction feasibility, and emergency planners identify dangerous terrain features that require special safety protocols.
What geological features can be highlighted with custom gradients?
Custom gradients can reveal rock formations using high-contrast colors (deep reds for granite, bright oranges for volcanic basalt), soil composition through brown-to-yellow schemes indicating fertility levels, and mineral deposits using metallic color gradients to help geologists visualize resource distribution for mining operations.
How can weather and climate data be integrated into topographical maps?
Weather and climate data integration transforms topographical maps into dynamic environmental tools. This includes temperature overlays using thermal color schemes for microclimatic variations, precipitation patterns with blue-to-white gradients, and seasonal variation schemes that show quarterly climate changes across different terrain features.