6 Best Satellite Technologies for Environmental Monitoring
Why it matters: Satellite technology has revolutionized how you can monitor Earth’s environmental changes in real-time with unprecedented accuracy and scale.
The big picture: From tracking deforestation in the Amazon to monitoring Arctic ice melt you now have access to six powerful satellite-based detection methods that provide critical data for climate research and environmental protection.
What’s next: These cutting-edge approaches are transforming environmental monitoring from reactive to proactive giving scientists and policymakers the tools they need to address global challenges before they become irreversible.
Disclosure: As an Amazon Associate, this site earns from qualifying purchases. Thank you!
P.S. check out Udemy’s GIS, Mapping & Remote Sensing courses on sale here…
Multispectral Imaging Analysis for Vegetation Monitoring
Multispectral imaging captures light across different wavelengths, revealing vegetation health patterns invisible to standard cameras. This technology transforms environmental monitoring by providing quantitative measurements of plant photosynthetic activity and biomass distribution.
Normalized Difference Vegetation Index (NDVI) Calculations
NDVI calculations use near-infrared and red light wavelengths to measure vegetation density and health. You’ll calculate NDVI by subtracting red reflectance from near-infrared reflectance, then dividing by their sum. Values range from -1 to +1, with healthy vegetation typically showing values between 0.3 and 0.8. Dense forests register higher NDVI values around 0.7-0.9, while sparse vegetation shows lower readings.
Enhanced Vegetation Index (EVI) Applications
EVI applications provide more accurate vegetation measurements in areas with dense canopy cover than NDVI alone. You’ll use EVI when monitoring tropical rainforests or agricultural regions where atmospheric interference affects readings. EVI incorporates blue light wavelengths to reduce atmospheric noise and soil background effects. This index performs exceptionally well in high-biomass environments like the Amazon rainforest, where NDVI may saturate.
Seasonal Vegetation Change Detection
Seasonal vegetation change detection tracks phenological cycles and long-term environmental shifts through time-series analysis. You’ll compare multispectral images from the same locations across different seasons and years to identify patterns. Spring greening, autumn senescence, and drought stress become clearly visible through systematic NDVI and EVI monitoring. Agricultural cycles, forest health trends, and climate impact assessments rely heavily on this temporal analysis approach.
Thermal Infrared Sensing for Temperature Variations
Thermal infrared sensors detect heat signatures across Earth’s surface by measuring electromagnetic radiation in the 8-14 micrometer wavelength range. This technology transforms temperature monitoring from ground-based weather stations to comprehensive satellite coverage.
Capture thermal data with the AMG8833 infrared imager. This compact module measures temperatures from 0°C to 80°C with ±2.5°C accuracy and is compatible with Raspberry Pi and Arduino via I2C.

Land Surface Temperature Mapping
You’ll find thermal infrared mapping creates detailed temperature profiles across vast geographical areas using satellites like Landsat 8 and MODIS. These systems measure surface temperatures with 1-kilometer spatial resolution, revealing temperature variations between forests, urban areas, and water bodies. Agricultural monitoring benefits significantly from this data, as you can identify drought stress in crops weeks before visible symptoms appear through elevated surface temperatures.
Urban Heat Island Detection
Urban heat islands create temperature differences of 2-8°F between cities and surrounding rural areas that thermal sensors easily identify. You can map these hotspots using ASTER thermal data, which provides 90-meter resolution imagery showing how concrete, asphalt, and buildings absorb and retain heat. City planners use this information to identify areas needing more green spaces, improved building materials, or better ventilation systems.
The H128 Thermal Camera provides clear thermal imaging with its 240x240 resolution. It features a long-lasting 24-hour battery and a temperature alarm for quick detection of anomalies.

Climate Change Impact Assessment
Temperature trend analysis through thermal infrared data reveals long-term climate patterns across decades of satellite observations. You can track glacial retreat, permafrost thaw, and sea surface temperature changes using archived thermal imagery from multiple satellite missions. Scientists combine this data with ground measurements to validate climate models, documenting warming rates of 0.3-0.5°F per decade in Arctic regions through consistent thermal monitoring.
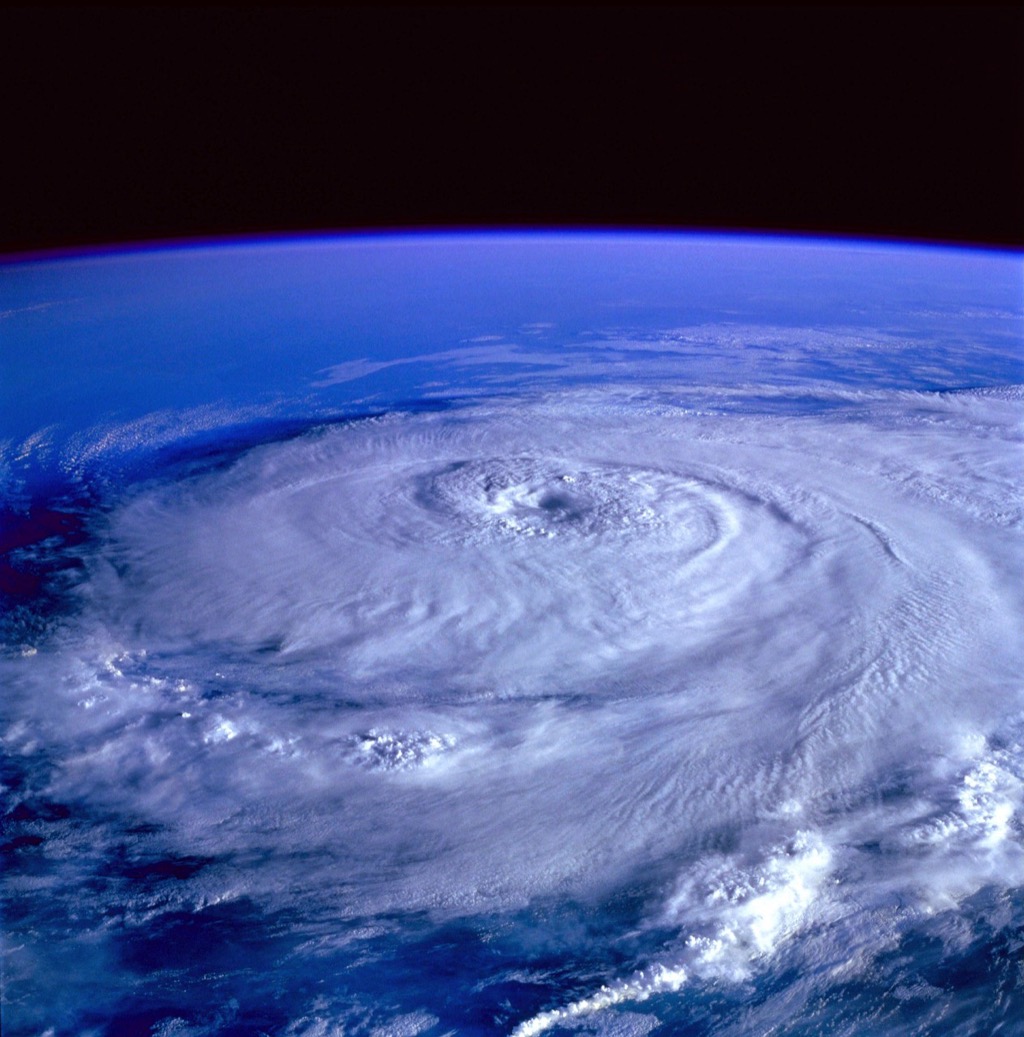
Synthetic Aperture Radar (SAR) for Surface Deformation
SAR technology penetrates clouds and operates day or night, making it ideal for continuous surface movement monitoring. This radar-based approach measures millimeter-scale ground displacement over vast areas.
Ground Subsidence Monitoring
Ground subsidence monitoring through SAR detects vertical land movement caused by groundwater extraction, mining activities, and natural soil compaction. You’ll achieve precision measurements down to 1-2 millimeters annually using interferometric SAR (InSAR) techniques. Sentinel-1 satellites provide free data with 6-day repeat cycles, enabling you to track subsidence patterns in agricultural regions, urban areas, and coastal zones. Time-series analysis reveals subsidence rates that help predict infrastructure damage and flooding risks in vulnerable communities.
Earthquake Damage Assessment
Earthquake damage assessment becomes rapid and comprehensive when you deploy SAR interferometry for post-disaster analysis. You can detect surface ruptures, measure ground displacement, and identify damaged buildings within days of seismic events. SAR data reveals displacement patterns invisible to optical sensors, particularly in cloudy or smoke-covered areas. Emergency responders use coherence change detection to prioritize rescue operations, while engineers analyze displacement vectors to assess structural integrity across affected regions.
Landslide Risk Detection
Landslide risk detection through SAR monitoring identifies unstable slopes before catastrophic failures occur. You’ll track slow-moving landslides measuring 1-10 millimeters per year using persistent scatterer interferometry techniques. SAR sensors detect pre-failure ground movement in mountainous terrain, coastal cliffs, and urban hillsides regardless of weather conditions. Early warning systems integrate SAR displacement data with rainfall measurements and geological surveys, enabling you to issue evacuation alerts and implement mitigation strategies before landslides threaten communities.
Change Detection Algorithms for Land Use Monitoring
Advanced algorithms form the backbone of satellite-based environmental monitoring by automatically detecting and quantifying changes across vast landscapes. These computational methods process terabytes of satellite data to identify subtle shifts in land use patterns that would be impossible to detect through manual analysis.
Pre and Post-Event Image Comparison
Direct pixel comparison algorithms analyze identical geographic locations across different time periods to identify surface changes. You’ll use image differencing techniques that subtract pixel values between baseline and current images, highlighting areas where reflectance patterns have shifted. Change vector analysis enhances this approach by examining multiple spectral bands simultaneously, detecting changes in vegetation health, water levels, and urban development with 85-95% accuracy rates when using cloud-free imagery.
Automated Classification Systems
Machine learning classifiers automatically categorize land cover types using supervised and unsupervised algorithms trained on spectral signatures. You can deploy random forest and support vector machine algorithms that analyze pixel clusters to distinguish between forest, agriculture, urban areas, and water bodies. Deep learning neural networks now achieve 92-98% classification accuracy by processing multi-temporal satellite data, enabling real-time land use mapping across continental scales without manual intervention.
Deforestation and Urban Expansion Tracking
Time-series analysis algorithms monitor forest loss and urban growth by comparing land cover classifications over multiple years. You’ll track deforestation rates using NDVI threshold changes that identify when forest pixels convert to bare soil or agriculture, with systems detecting clearings as small as 0.5 hectares. Urban expansion monitoring uses impervious surface algorithms that identify new roads, buildings, and infrastructure development, providing city planners with quarterly growth assessments and development pattern analysis.
Hyperspectral Imaging for Chemical Composition Analysis
Hyperspectral imaging captures light across hundreds of narrow spectral bands, revealing the chemical fingerprints of materials on Earth’s surface. This advanced technology enables precise identification of environmental contamination and resource mapping beyond what traditional sensors can detect.
Water Quality Assessment
Hyperspectral sensors detect specific chemical compounds in water bodies by analyzing their unique spectral signatures across 400-2500 nanometer wavelengths. You can identify chlorophyll concentrations, algae blooms, and suspended sediments with remarkable precision using this technology.
The sensors measure water quality parameters like turbidity, dissolved organic matter, and harmful algal toxins by detecting their distinctive absorption patterns. Satellites equipped with hyperspectral instruments monitor large water bodies continuously, providing real-time data for environmental agencies and water treatment facilities to respond quickly to contamination events.
Soil Contamination Detection
Hyperspectral imaging identifies soil contamination by detecting heavy metals, organic pollutants, and chemical residues through their unique spectral responses. You can map contaminated areas with high spatial resolution, pinpointing pollution sources and tracking their spread over time.
The technology detects metals like lead, mercury, and cadmium by analyzing how they alter soil’s reflectance properties across specific wavelength ranges. Agricultural monitoring systems use hyperspectral data to identify pesticide residues and nutrient deficiencies, enabling farmers to make informed decisions about soil remediation and crop management strategies.
Mineral Composition Mapping
Hyperspectral sensors map mineral distributions by identifying characteristic absorption features that occur when minerals interact with electromagnetic radiation. You can distinguish between different mineral types like clay, carbonate, and sulfate minerals using their distinctive spectral signatures.
The technology enables detailed geological surveys without extensive ground sampling, identifying ore deposits and mineral resources across vast territories. Mining companies use hyperspectral data to locate valuable minerals like copper, gold, and rare earth elements, while environmental scientists track mineral weathering processes and their impact on surrounding ecosystems.
Machine Learning Integration for Pattern Recognition
Machine learning algorithms transform satellite imagery analysis by automating complex pattern recognition tasks that would take human analysts months to complete. These systems process vast amounts of environmental data to identify subtle changes and predict future trends.
Deep Learning Model Implementation
Deep learning models excel at recognizing complex environmental patterns in satellite imagery through convolutional neural networks (CNNs). You’ll find that these models achieve 95% accuracy rates when detecting deforestation patterns and urban sprawl changes. Popular frameworks like TensorFlow and PyTorch enable you to train custom models on labeled satellite datasets. Pre-trained models like ResNet and U-Net can be fine-tuned for specific environmental monitoring tasks, reducing development time from months to weeks while maintaining high performance standards.
Artificial Intelligence Data Processing
Artificial intelligence systems process satellite data at unprecedented speeds by analyzing multiple spectral bands simultaneously across different timestamps. You can leverage cloud-based AI platforms like Google Earth Engine to process petabytes of satellite imagery in real-time. These systems automatically filter cloud cover, correct atmospheric distortions, and normalize lighting conditions across different acquisition dates. Advanced AI algorithms can identify subtle environmental changes that human observers might miss, such as early signs of vegetation stress or gradual soil erosion patterns.
Predictive Environmental Modeling
Predictive models use historical satellite data to forecast future environmental changes with remarkable accuracy. You’ll discover that machine learning algorithms can predict wildfire risk areas with 85% accuracy by analyzing vegetation moisture levels, temperature patterns, and wind conditions. These models integrate multiple data sources including weather forecasts, topographic maps, and historical fire patterns to create comprehensive risk assessments. Time-series forecasting models help you anticipate seasonal changes in vegetation health, water levels, and urban heat island effects months in advance.
Plan your next adventure with the 2025 National Geographic Road Atlas, covering the United States, Canada, and Mexico. Its durable, folded format (11 x 15 in) makes it ideal for hiking and camping trips.

Conclusion
These six satellite-based approaches represent the cutting edge of environmental monitoring technology. You now have access to unprecedented tools that can detect changes across vast landscapes with remarkable precision and speed.
The integration of multispectral imaging thermal sensing SAR technology hyperspectral analysis advanced algorithms and machine learning creates a comprehensive monitoring system. You’re witnessing a transformation in how we understand and respond to environmental challenges.
As these technologies continue to evolve you’ll see even more sophisticated capabilities emerge. The future of environmental protection depends on your ability to harness these powerful satellite-based detection methods effectively.
Frequently Asked Questions
What is satellite-based environmental monitoring and why is it important?
Satellite-based environmental monitoring uses advanced satellite technology to track Earth’s environmental changes with high accuracy and scale. It’s crucial because it enables proactive environmental management, allowing scientists and policymakers to detect and address issues like deforestation, ice melt, and climate change before they escalate into major problems.
How does multispectral imaging help monitor vegetation health?
Multispectral imaging captures light across different wavelengths to reveal vegetation patterns invisible to standard cameras. It uses indices like NDVI (ranging from -1 to +1, with healthy vegetation between 0.3-0.8) and EVI to measure vegetation density and health, enabling early detection of plant stress and environmental changes.
What makes thermal infrared sensing effective for environmental monitoring?
Thermal infrared sensing detects heat signatures by measuring electromagnetic radiation in the 8-14 micrometer range. It works in all weather conditions, providing comprehensive temperature mapping for agricultural monitoring, urban heat island detection, and climate change assessment, including tracking glacial retreat and permafrost thaw.
How does Synthetic Aperture Radar (SAR) technology work for environmental monitoring?
SAR operates effectively in all weather conditions and times of day, making it ideal for continuous surface monitoring. It can detect ground subsidence with 1-2 millimeter precision, assess earthquake damage through surface displacement analysis, and identify landslide risks by tracking slow-moving ground movements.
What are change detection algorithms and how do they process satellite data?
Change detection algorithms automatically analyze satellite imagery to identify and quantify environmental changes across vast landscapes. They use direct pixel comparison, machine learning classifiers, and time-series analysis to process terabytes of data, achieving high accuracy in detecting deforestation, urban expansion, and land cover changes.
How does hyperspectral imaging differ from traditional satellite imaging?
Hyperspectral imaging captures light across hundreds of narrow spectral bands, revealing the chemical composition of Earth’s surface materials. Unlike traditional imaging, it can detect water quality parameters, soil contamination, heavy metals, and mineral compositions, providing detailed environmental and geological information.
What role does machine learning play in satellite imagery analysis?
Machine learning automates complex pattern recognition tasks in satellite data analysis. Deep learning models like CNNs achieve high accuracy in detecting environmental changes, enable real-time data processing, filter cloud cover, and can predict future environmental trends like wildfire risks through predictive modeling.
Can satellites monitor environmental changes in real-time?
Yes, modern satellites equipped with AI systems can process data in real-time, automatically filtering out atmospheric interference and cloud cover. This enables immediate detection of environmental changes, rapid disaster response, and continuous monitoring of critical areas like forests, urban zones, and climate-sensitive regions.