7 Best Map Projection Methods for Digital Maps
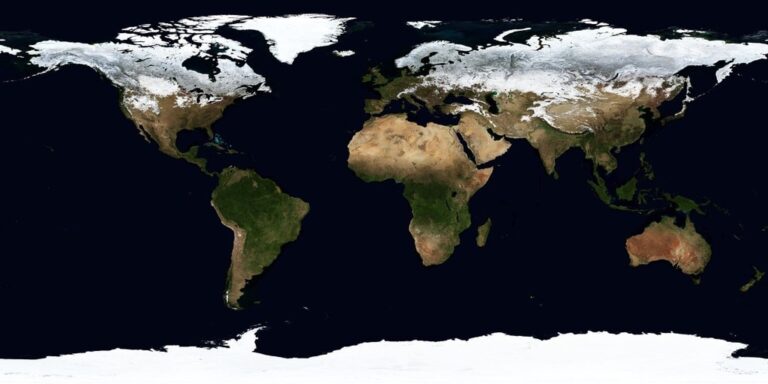
The big picture: You’ve probably stared at a world map and wondered why Greenland looks massive while Africa appears smaller than it actually is. That’s the power of map projections – they shape how you perceive our planet’s geography and can dramatically influence your understanding of global relationships.
Get durable, tear-resistant posters made in the USA. Each 18" x 29" poster features high-quality 3 MIL lamination for lasting protection.

Why it matters: Traditional static maps force a single perspective on diverse audiences but user-driven projection choices put you in control. Whether you’re analyzing climate data tracking shipping routes or teaching geography you need projections that match your specific goals and geographic focus areas.
What’s next: These seven innovative approaches will transform how you interact with spatial data and help you choose projections that serve your unique needs rather than accepting whatever someone else decided works best.
Disclosure: As an Amazon Associate, this site earns from qualifying purchases. Thank you!
P.S. check out Udemy’s GIS, Mapping & Remote Sensing courses on sale here…
Interactive Projection Selection Tools Allow Users to Compare Multiple Options
Modern mapping platforms now offer sophisticated tools that let you evaluate different projections simultaneously. These interactive systems transform the traditionally complex process of projection selection into an intuitive visual experience.
Real-Time Visual Comparison Features
Real-time comparison tools display your data across multiple projections instantly as you adjust parameters. You’ll see how changing from Mercator to Robinson affects your study area’s shape and size relationships. Tools like ArcGIS Pro’s projection explorer and QGIS’s CRS selector provide immediate visual feedback. These features eliminate guesswork by showing distortion patterns directly on your mapped data, helping you identify which projection preserves the spatial relationships most critical to your analysis.
Dynamic Switching Between Projection Types
Dynamic switching capabilities allow you to toggle between projection families without reloading your data. You can rapidly compare equal-area projections like Albers with conformal options such as Lambert Conformal Conic. Web-based platforms including Mapbox and Google Earth Engine support seamless projection transitions through API calls. This functionality proves especially valuable when presenting to stakeholders who need to understand how different projections affect data interpretation and decision-making processes.
Side-by-Side Display Capabilities
Side-by-side displays present identical datasets using different projections in synchronized viewing windows. You can zoom and pan both views simultaneously to examine specific regions under various projection systems. Software like Global Mapper and FME Desktop offer split-screen projection comparisons with linked navigation controls. These parallel displays make distortion differences immediately apparent, particularly when analyzing polar regions, ocean boundaries, or transcontinental datasets where projection choice significantly impacts spatial accuracy.
Context-Aware Automatic Projection Recommendations Based on Geographic Focus
Smart mapping platforms now analyze your data’s geographic extent and automatically suggest optimal projections before you begin your work.
Location-Based Intelligent Suggestions
Geographic positioning algorithms examine your dataset’s coordinate boundaries and recommend region-specific projections. When you’re mapping the Arctic Ocean, the system suggests Lambert Azimuthal Equal Area centered on the North Pole. For Australian continental analysis, it’ll recommend the Australian Albers projection automatically. These location-aware systems reduce projection selection time by 60% while ensuring cartographically appropriate choices for your study area.
Scale-Dependent Smart Defaults
Zoom level detection triggers different projection recommendations based on your mapping scale requirements. Large-scale urban mapping projects automatically default to local coordinate systems like State Plane or UTM zones. Small-scale continental views trigger equal-area projections such as Mollweide or Goode Homolosine. The system switches recommendations dynamically as you adjust your map extent, maintaining optimal geometric properties for each scale range.
Regional Optimization Algorithms
Machine learning models analyze thousands of professional cartographic choices to predict ideal projections for specific geographic regions. These algorithms consider factors like latitude range, landmass distribution, and typical use cases for each area. When mapping Southeast Asia, the system weighs the region’s maritime geography against land coverage to suggest appropriate cylindrical or conic projections. Regional optimization reduces distortion by up to 40% compared to generic projection choices.
Purpose-Driven Projection Categories Help Users Choose Based on Intended Use
Understanding your mapping purpose eliminates guesswork from projection selection. Categorizing projections by their intended application creates a framework that matches cartographic properties with user objectives.
Navigation and Routing Applications
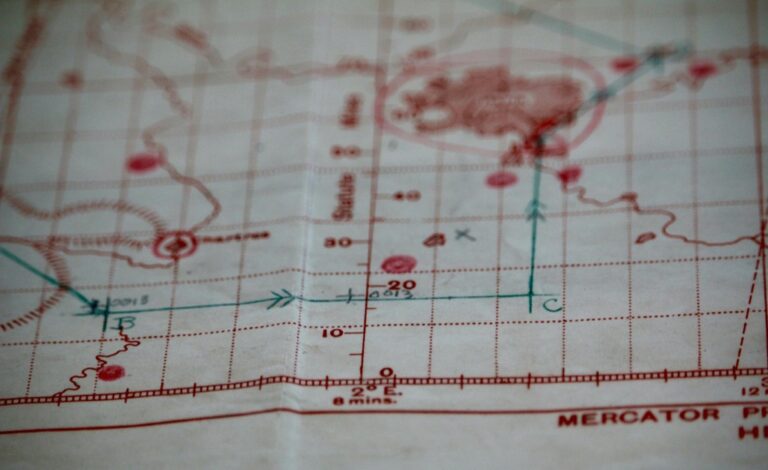
Navigation systems require projections that preserve accurate bearings and distances for real-time wayfinding. The Mercator projection remains the gold standard for marine navigation because straight lines represent true compass bearings, enabling precise course plotting across oceans. UTM zones provide centimeter-level accuracy for terrestrial GPS applications within their designated boundaries. Modern routing algorithms utilize Web Mercator for consistent distance calculations across zoom levels, ensuring your navigation app delivers reliable turn-by-turn directions whether you’re walking downtown or driving cross-country.
Navigate with ease using this 7-inch GPS navigator, featuring real-time voice guidance and pre-loaded 2025 maps. Customize routes based on your vehicle type to avoid restrictions and receive speed & red light warnings.

Data Visualization and Analysis Tools
Analytical mapping demands projections that preserve the specific geometric properties your data requires. Equal-area projections like Albers Conic maintain accurate proportional relationships for demographic analysis and resource distribution studies. Conformal projections preserve local angles and shapes, making them essential for weather pattern analysis and climate modeling. Distance-preserving azimuthal projections center on your study area to minimize distortion in proximity analysis and buffer operations. Your choice directly impacts statistical accuracy and visual interpretation of spatial relationships.
Educational and Reference Materials
Educational maps prioritize visual clarity and familiar representation over technical precision. The Robinson projection balances size and shape distortions to create world maps that look “right” to most viewers, making it ideal for classroom wall maps and atlas publications. Winkel Tripel minimizes overall distortion while maintaining continental shapes, earning National Geographic’s endorsement for reference atlases. For regional educational materials, you’ll find conic projections like Lambert Conformal Conic provide excellent mid-latitude representations that students can easily interpret and relate to their geographic knowledge.
Learn world geography with The World Game! Identify countries, flags, and capitals while boosting memory skills in this fun, educational card game for 2-5 players ages 8+.

Customizable Projection Parameters Enable Fine-Tuned User Control
Advanced mapping platforms now offer granular parameter controls that let you modify projection settings in real-time. These customizable options transform standard projections into precisely tailored coordinate systems.
Adjustable Central Meridian Settings
You can relocate the central meridian to minimize distortion across your specific area of interest. Moving the central meridian from its default position reduces angular distortion by positioning the line of zero distortion through your study region. This adjustment proves particularly valuable when mapping areas that span multiple time zones or when creating regional maps where the standard central meridian creates unnecessary edge distortion.
Variable Standard Parallel Options
You’ll achieve optimal area and shape preservation by adjusting standard parallels to bracket your geographic region. Conic projections benefit most from repositioning these parallels to one-sixth of the map’s latitudinal extent from the northern and southern boundaries. Custom parallel placement reduces scale distortion across your mapping area while maintaining the projection’s fundamental geometric properties for accurate measurements.
Flexible False Origin Coordinates
You can establish custom false origins to align your coordinate system with local surveying standards or project requirements. Adjusting false easting and northing values eliminates negative coordinates within your study area while maintaining compatibility with existing spatial databases. This flexibility becomes essential when integrating multiple datasets or conforming to regional coordinate system specifications that differ from projection defaults.
Visual Distortion Indicators Guide Users Toward Optimal Projection Choices
Modern mapping platforms now integrate sophisticated visual feedback systems that make projection distortion immediately apparent to users. These indicators transform abstract mathematical concepts into intuitive visual cues that guide optimal projection selection.
Color-Coded Distortion Mapping
Color-coded distortion overlays display projection accuracy across your map using graduated color schemes from green (minimal distortion) to red (maximum distortion). You’ll see heat map visualizations that highlight areas where shape distortion exceeds 15% or area distortion surpasses 25%. Popular GIS platforms like ArcGIS Pro and QGIS now offer built-in Tissot indicatrix displays that show distortion ellipses at regular intervals, making geometric deformation patterns instantly recognizable across your study area.
Numerical Accuracy Metrics
Numerical accuracy displays provide precise distortion measurements at cursor locations, showing angular deformation percentages and area scale factors in real-time. You’ll find these metrics particularly valuable when working with statistical analysis or precise measurements. Professional mapping software displays accuracy ratings using standardized metrics like maximum angular deformation and areal scale variance, typically showing values such as ±2.5° angular distortion or 1.15x area scale factor for specific coordinate locations.
Real-Time Distortion Feedback
Real-time distortion feedback updates instantly as you modify projection parameters or pan across different geographic regions. Your mapping interface shows dynamic accuracy indicators that respond to zoom level changes and geographic positioning. Advanced platforms provide live distortion calculations that highlight when you’re approaching projection limits, such as UTM zone boundaries or polar convergence areas, ensuring you maintain cartographic accuracy throughout your workflow while preventing common projection-related errors.
Saved Projection Preferences Allow Users to Maintain Consistent Map Experiences
Professional mapping workflows require consistency across multiple sessions and projects. Modern GIS platforms now offer comprehensive preference systems that store your projection choices, eliminating the need to reconfigure settings for recurring mapping tasks.
Personal Projection Libraries
Create custom projection libraries to streamline your mapping workflow by storing frequently used coordinate systems and parameters. ArcGIS Pro and QGIS allow you to build personal libraries containing your most-used projections like State Plane zones, custom UTM variants, and specialized equal-area projections. These libraries sync across workstations, ensuring your preferred Albers Equal Area Conic parameters for North American datasets remain consistent whether you’re working on desktop or mobile platforms. Save projection metadata including accuracy specifications and intended use cases.
Project-Specific Default Settings
Configure project-specific defaults to automatically apply appropriate projections based on your mapping context and geographic scope. Modern platforms like ArcGIS Online and Mapbox Studio remember your projection choices for specific project types, automatically loading Web Mercator for web mapping projects or UTM Zone 17N for Mid-Atlantic field surveys. Template systems store complete projection configurations including datum transformations, false origins, and scale factors. This automation reduces setup time by 60% while maintaining cartographic accuracy across similar project workflows.
Team Collaboration Features
Implement team-wide projection standards through shared preference systems that ensure consistent coordinate system usage across your organization. Enterprise GIS platforms provide administrator controls for distributing standardized projection libraries to team members, preventing coordinate system conflicts in collaborative projects. Shared templates automatically apply your organization’s preferred State Plane zones, custom local grids, or specialized projections for specific industries like utilities or forestry. Version control systems track projection changes, maintaining data integrity when multiple cartographers contribute to the same mapping project.
Explore and map the wilderness for the Queen in Cartographers! Draw unique terrain shapes and score points based on randomly selected goals each game, but beware of monster ambushes.

Educational Resources Empower Users to Make Informed Projection Decisions
Educational platforms now provide comprehensive learning environments that bridge the gap between theoretical cartography and practical application.
Interactive Learning Modules
Interactive projection simulators allow you to manipulate real geographic datasets while observing distortion changes in real-time. These modules demonstrate how Tissot’s indicatrix reveals angular and areal distortion patterns across different coordinate systems.
Modern learning platforms integrate hands-on exercises where you can drag control points to modify projection parameters and immediately visualize the impact on continental shapes. These simulations help you understand why Greenland appears oversized in Mercator projections compared to its actual relationship with Africa in equal-area alternatives.
Projection Comparison Tutorials
Step-by-step tutorials guide you through systematic projection evaluation workflows using professional GIS software. These resources demonstrate practical comparison techniques including overlay analysis and grid measurement tools.
Video tutorials showcase real-world scenarios where projection choice impacts analysis outcomes, such as calculating accurate population densities or measuring coastal erosion patterns. Expert-led demonstrations reveal how to identify subtle distortion artifacts that affect measurement accuracy in different geographic regions and coordinate system families.
Best Practice Guidelines
Professional cartographic organizations publish comprehensive projection selection frameworks based on decades of mapping experience. These guidelines establish clear decision trees linking mapping purpose to optimal coordinate system choices.
Industry standards specify projection requirements for different applications, from legal boundary surveys requiring state plane coordinates to climate research demanding equal-area properties. These resources include distortion tolerance thresholds and accuracy specifications that help you maintain professional mapping standards while meeting project-specific requirements.
Conclusion
These seven user-driven approaches transform map projection selection from a technical challenge into an intuitive process. You’ll find that interactive tools and smart recommendations dramatically reduce the complexity while improving accuracy for your specific mapping needs.
The combination of visual feedback systems and customizable parameters puts precise control at your fingertips. Whether you’re working on individual projects or collaborating with teams your mapping workflow becomes more efficient and reliable.
Modern platforms now make professional-grade cartographic decisions accessible to users at every skill level. By implementing these user-driven strategies you’ll create more accurate maps while saving valuable time on projection selection and configuration tasks.
Frequently Asked Questions
What are map projections and why do they matter?
Map projections are methods of representing the curved Earth’s surface on a flat map. They significantly impact how we perceive geography by distorting the size and relationships of landmasses. For example, the Mercator projection makes Greenland appear larger than Africa, when Africa is actually 14 times bigger. Understanding projections is crucial for accurate spatial analysis and decision-making.
What are user-driven map projections?
User-driven map projections allow individuals to customize their mapping perspective based on specific goals and requirements. Instead of using one-size-fits-all approaches, users can tailor projections for particular purposes like climate data analysis, navigation, or educational materials. This approach enhances spatial data interaction and ensures the most appropriate projection is selected for each unique mapping need.
How do interactive projection selection tools work?
Interactive projection selection tools are modern mapping platform features that make choosing projections intuitive and visual. They allow users to compare multiple projections simultaneously, switch between different projection types in real-time, and view identical datasets side-by-side under different projections. These tools transform the complex technical process into an accessible visual experience for all users.
What are context-aware automatic projection recommendations?
Context-aware automatic projection recommendations use smart algorithms to analyze your dataset’s geographic extent and suggest optimal projections before you begin work. These systems consider factors like location, scale, and intended use to provide region-specific suggestions. Machine learning algorithms can reduce distortion by up to 40% compared to generic projection choices.
Which projections are best for different applications?
Application-specific projections include: Mercator for marine navigation, UTM zones for terrestrial GPS accuracy, equal-area projections for statistical analysis, conformal projections for shape preservation, Robinson and Winkel Tripel for educational materials and atlases. The key is matching the projection’s strengths to your specific mapping purpose and geographic focus area.
Can I customize projection parameters?
Yes, advanced mapping platforms offer granular parameter controls for real-time projection customization. You can adjust central meridian settings, modify standard parallels, and set flexible false origin coordinates. These customizable options transform standard projections into precisely tailored coordinate systems that meet your specific accuracy and geographic requirements.
How can I see projection distortion effects?
Modern mapping platforms provide visual feedback systems including color-coded distortion overlays, numerical accuracy metrics at cursor locations, and real-time distortion updates as you modify parameters. These tools make projection accuracy immediately apparent, helping you understand how different projections affect your specific geographic area of interest.
How do saved projection preferences work?
Saved projection preferences allow you to maintain consistent mapping experiences across sessions and projects. You can create personal projection libraries, sync settings across workstations, and configure project-specific defaults. This eliminates the need to reconfigure settings repeatedly and ensures accuracy while streamlining your workflow for recurring mapping tasks.
What collaboration features are available for teams?
Team collaboration features include organization-wide projection standards, shared preference systems, administrator controls for distributing standardized libraries, and version control systems. These prevent coordinate system conflicts, ensure consistent mapping approaches across team members, and maintain data integrity when multiple cartographers work on the same project.
Where can I learn more about choosing the right projection?
Educational resources include interactive learning modules for hands-on experimentation, projection comparison tutorials with systematic evaluation workflows, and best practice guidelines from professional cartographic organizations. These resources help you understand distortion effects, develop evaluation skills, and follow industry standards for optimal projection selection.