5 Best Historical Map Scaling Techniques
Why it matters: Historical maps offer invaluable insights into past civilizations but their original scales often don’t match modern mapping standards or research needs.
Explore history's most significant maps with *Great Maps*. This book delves into cartographic masterpieces and their historical context.

The challenge: You need reliable methods to resize these precious documents without losing accuracy or destroying important geographic relationships that historians spent decades documenting.
What’s ahead: We’ll walk you through five proven techniques that professional cartographers and historians use to scale historical maps while preserving their integrity and usefulness for contemporary analysis.
Disclosure: As an Amazon Associate, this site earns from qualifying purchases. Thank you!
P.S. check out Udemy’s GIS, Mapping & Remote Sensing courses on sale here…
Understanding Map Scale and Its Historical Significance
You’ll find that grasping map scale fundamentals becomes essential when working with historical cartographic materials that require modern adaptation.
Definition of Map Scale in Cartographic Context
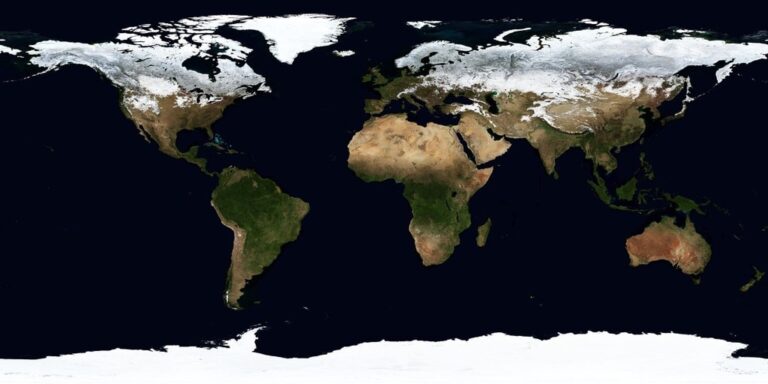
Map scale represents the ratio between distances on a map and corresponding distances in the real world. You’ll encounter three primary scale expressions: representative fractions (1:24,000), verbal scales (“one inch equals one mile”), and graphic scales shown as bar measurements. Historical cartographers often used local measurement units like chains, rods, or regional variants that don’t translate directly to modern metric or imperial systems. Understanding these scale relationships helps you maintain proportional accuracy when digitizing or reproducing antique maps for contemporary use.
Why Historical Maps Often Lack Consistent Scaling
Explore history's most significant maps with *Great Maps*. This book delves into cartographic masterpieces and their historical context.
Historical maps frequently display inconsistent scaling due to the surveying limitations and technological constraints of their time periods. You’ll notice that many pre-1800 maps prioritize political boundaries or trade routes over mathematical precision, resulting in distorted geographic relationships. Cartographers working without modern surveying instruments relied on compass bearings, estimated distances, and secondhand geographic information that introduced cumulative errors. Additionally, many historical maps served decorative or political purposes rather than navigation, leading mapmakers to emphasize artistic elements over strict adherence to uniform scale measurements.
The Relationship Between Scale and Geographic Accuracy
Scale directly impacts the level of geographic detail and positional accuracy you can achieve in historical map reproduction. Large-scale maps (1:10,000 or larger) typically provide more precise coordinate information and allow for detailed feature placement during digitization processes. You’ll find that small-scale historical maps often contain generalized coastlines, simplified river systems, and approximate settlement locations that require careful interpretation during scaling operations. Modern GIS professionals must balance maintaining the historical map’s original character while correcting obvious geometric distortions that would compromise spatial analysis or overlay operations with contemporary datasets.
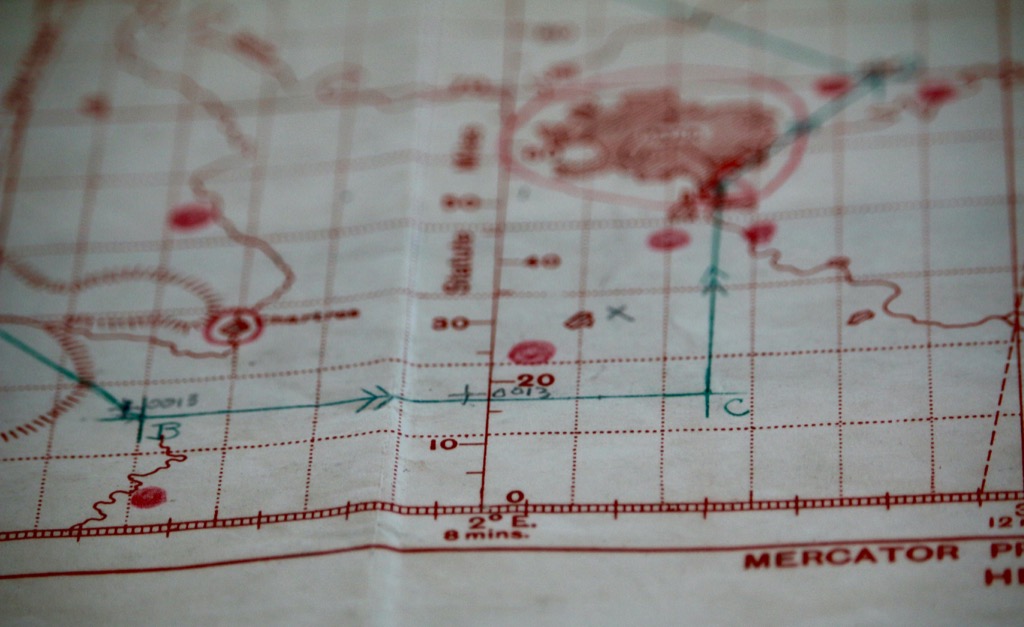
Technique 1: Grid Reference System Method
The grid reference system establishes a mathematical framework for accurate historical map scaling through precise coordinate mapping. You’ll create controlled reference points that maintain geographic relationships during the scaling process.
Creating a Proportional Grid Overlay
You’ll position a uniform grid over your historical map using known coordinate systems like UTM or State Plane coordinates. Establish grid cells of equal dimensions – typically 1km or 5km squares depending on your map’s original scale. Mark intersection points where grid lines cross identifiable geographic features such as river confluences, mountain peaks, or settlement centers. This overlay becomes your geometric foundation for maintaining proportional relationships during scaling transformations.
Achieve a flawless, even complexion with e.l.f. Flawless Satin Foundation. This lightweight, vegan formula provides medium coverage and a semi-matte finish for all-day wear, while hydrating your skin with glycerin.

Measuring Known Geographic Features as Reference Points
You’ll locate permanent geographic landmarks that appear on both your historical map and modern reference materials. Measure distances between church spires, bridge crossings, prominent hills, or coastal features using the grid overlay coordinates. Record these measurements in decimal degrees or projected coordinate units for consistency. Compare your historical measurements against verified modern coordinates from USGS databases or GPS surveys to calculate scaling factors for different map regions.
Tools and Software for Grid-Based Scaling
You’ll achieve professional results using ArcGIS Pro’s georeferencing toolbar or QGIS’s georeferencer plugin for automated grid scaling workflows. MapAnalyst software provides specialized tools for historical map transformation with distortion visualization capabilities. For manual approaches, use Adobe Illustrator‘s perspective grid tool or CAD software like AutoCAD Map 3D. Digital calipers and proportional dividers remain essential for measuring precise distances on paper maps before digitization.
Learn Adobe Illustrator with the 2025 release of this comprehensive guide. Master essential skills through hands-on lessons.

Technique 2: Comparative Landmark Analysis
Comparative landmark analysis leverages permanent geographic features to establish accurate scaling relationships between historical and modern maps. You’ll identify unchanging natural features that serve as reliable reference points for precise measurements.
Identifying Permanent Geographic Features
Mountain peaks represent the most reliable landmarks for scaling analysis since their positions remain constant across centuries. Rivers, coastlines, and prominent ridges also provide excellent reference points, though you must account for natural changes over time. Focus on identifying at least three well-distributed landmarks across your historical map to establish a comprehensive scaling framework. Document each feature’s coordinates from both historical and modern sources to calculate precise scaling ratios.
Using Modern Satellite Data for Reference
Google Earth Pro and USGS Earth Explorer provide high-resolution satellite imagery for landmark verification and coordinate extraction. You can overlay historical maps directly onto satellite basemaps to identify corresponding features and measure distances accurately. Modern GPS coordinates from these platforms serve as your ground truth for scaling calculations. Export coordinate data in decimal degrees format to maintain precision during your comparative analysis workflow.
Cross-Referencing Multiple Historical Sources
Multiple historical maps from the same time period help verify landmark positions and reduce individual mapping errors. Compare your primary historical map against contemporary surveys, military maps, and exploratory charts to identify consistent geographic features. This triangulation approach minimizes the impact of individual cartographer biases or surveying limitations. Cross-reference at least two additional historical sources to validate your landmark selections before proceeding with scaling calculations.
Technique 3: Mathematical Ratio Calculation
Mathematical ratio calculation provides the most precise method for scaling historical maps when you have reliable distance measurements. This technique transforms your historical cartographic data into mathematically accurate representations suitable for modern analysis.
Determining Original Scale Using Known Distances
Identify measurable distances on your historical map that correspond to known real-world measurements. You’ll find the most reliable distances between permanent landmarks like church spires, mountain peaks, or river confluences that appear on both historical and modern maps. Measure these distances directly on your historical map using digital calipers or ruler tools in mapping software. Calculate your scale ratio by dividing the real-world distance by the map distance, expressed as 1:X format. Document multiple distance measurements across different map regions to verify consistency and identify potential distortions in the original surveying work.
Get precise measurements with this durable stainless steel digital caliper. Easily switch between inch, millimeter, and fraction units on the large LCD screen for versatile use.

Converting Between Different Measurement Units
Historical maps often use obsolete measurement systems that require conversion to modern metric or imperial units before scaling calculations. Common historical units include chains (66 feet), rods (16.5 feet), furlongs (660 feet), and various regional measurements like German miles or French lieues. Create conversion tables for the specific measurement systems used in your map’s time period and geographic region. Use online conversion calculators or reference materials from the National Institute of Standards and Technology to ensure accuracy. Apply these conversions systematically to all measurements before calculating your final scaling ratios for consistent results.
Applying Geometric Principles to Historical Maps
Geometric correction addresses the inherent distortions found in historical maps due to limited surveying techniques and projection methods. Use triangulation principles to establish accurate geometric relationships between three or more known points on your map. Apply the Pythagorean theorem to verify right-angle relationships in urban grid systems or property boundaries. Implement affine transformations in GIS software to correct for rotation, scaling, and skewing issues while preserving the relative positions of geographic features. Test your geometric corrections by comparing calculated distances with known measurements to ensure your scaling maintains spatial accuracy across the entire map extent.
Technique 4: Digital Georeferencing Technology
Digital georeferencing technology transforms historical maps into spatially accurate datasets through automated coordinate assignment and systematic distortion correction.
GIS Software Applications for Map Scaling
ArcGIS Pro provides the most comprehensive georeferencing tools with advanced rubber sheeting capabilities and automatic tie point generation. You’ll access polynomial transformation options and spline interpolation methods for complex historical map corrections. QGIS offers robust open-source georeferencing through its dedicated plugin with support for multiple transformation algorithms. MapInfo Professional excels at handling vintage coordinate systems and provides specialized tools for cadastral map scaling. Global Mapper delivers efficient batch processing capabilities for large historical map collections requiring consistent scaling workflows.
Coordinate System Transformation Methods
Affine transformations handle rotation, scaling, and translation simultaneously while preserving straight lines and parallel relationships in your historical maps. You’ll apply polynomial transformations for maps with significant non-linear distortions using second or third-order equations. Thin plate spline methods provide flexible rubber sheeting for maps with localized geometric errors. Projective transformations correct perspective distortions common in early surveying techniques. Helmert transformations work best for maps requiring only rotation, translation, and uniform scaling adjustments without complex geometric corrections.
Quality Control and Accuracy Verification
Root Mean Square Error (RMSE) calculations verify transformation accuracy by measuring residual errors at control points across your scaled historical map. You’ll maintain RMSE values below 2-3 pixels for acceptable geometric accuracy. Cross-validation testing involves withholding 20% of control points during transformation to assess prediction accuracy. Visual inspection identifies systematic distortions through overlay comparison with modern reference data. Statistical analysis of residual patterns reveals transformation adequacy and highlights areas requiring additional control points for improved scaling precision.
Technique 5: Triangulation and Control Point Method
Triangulation provides the most mathematically rigorous approach to scaling historical maps by establishing geometric relationships between multiple known points. This surveying-based method creates a network of interconnected reference points that enable precise scaling while maintaining spatial accuracy across the entire map.
Establishing Multiple Reference Points
You’ll need to identify at least three stable geographic features that appear on both your historical map and modern reference materials. Churches, major road intersections, and prominent topographic features work best as control points since they’ve remained relatively unchanged over time. Plot these points on both maps and assign precise coordinates using GPS data or high-accuracy survey records. Create a triangular network by connecting these control points, forming the geometric foundation for your scaling calculations. This network should cover the entire map area to ensure uniform scaling accuracy throughout the document.
Using Surveying Principles for Historical Maps
Apply traditional triangulation formulas to calculate distances and angles between your established control points. Measure the baseline distance between two control points on your historical map, then compare this to the known modern distance between the same features. Use the law of cosines and law of sines to determine scaling factors for different sections of the map. Calculate bearing angles from each control point to verify geometric consistency across your triangulation network. This surveying approach helps identify areas where the original mapmaker may have introduced intentional distortions or measurement errors.
Correcting for Projection Distortions
Historical maps often contain projection inconsistencies that create varying distortion patterns across different regions. Divide your map into triangular sections using your control point network, then calculate individual scaling factors for each triangle. Apply rubber sheeting techniques to gradually adjust distortions between triangular sections, maintaining smooth transitions at boundaries. Use polynomial transformation equations to correct systematic projection errors while preserving the map’s original character. This sectional approach ensures that local geographic relationships remain accurate even when the overall projection differs from modern standards.
Conclusion
Mastering these five scaling techniques transforms your approach to working with historical maps. You’ll find that combining multiple methods often yields the most accurate results for your specific project needs.
Each technique offers unique advantages depending on your map’s condition and available reference points. Grid systems excel with well-preserved documents while digital georeferencing handles severely distorted materials effectively.
Your success depends on selecting the right combination of tools and maintaining rigorous quality control throughout the process. Remember that patience and attention to detail separate professional results from amateur attempts.
These proven methods ensure you can confidently integrate historical cartographic data into modern analysis while preserving the authentic character that makes these documents invaluable to researchers and historians alike.
Frequently Asked Questions
What is map scale and why is it important for historical maps?
Map scale is the ratio between distances on a map and real-world distances. It’s crucial for historical maps because it determines accuracy and detail level. Historical maps often lack consistent scaling due to technological limitations of their time, making understanding scale essential for modern analysis and interpretation.
What are the three primary ways to express map scale?
The three primary expressions of map scale are representative fractions (like 1:50,000), verbal scales (such as “one inch equals one mile”), and graphic scales (visual bar scales). Each method helps cartographers and users understand the relationship between map distances and actual ground distances.
How does the Grid Reference System Method work for scaling historical maps?
The Grid Reference System Method establishes a mathematical framework by creating precise coordinate mapping. This technique overlays a grid system onto historical maps, allowing cartographers to establish accurate scaling relationships through systematic coordinate reference points and mathematical calculations.
What is Comparative Landmark Analysis in historical map scaling?
Comparative Landmark Analysis uses permanent geographic features like mountains, rivers, or coastlines that appear on both historical and modern maps. By comparing these unchanging landmarks, cartographers can establish accurate scaling relationships and correct distortions in historical maps.
Which GIS software applications are best for scaling historical maps?
Popular GIS software for historical map scaling includes ArcGIS Pro, QGIS, MapInfo Professional, and Global Mapper. Each offers unique tools for georeferencing, coordinate transformation, and distortion correction, allowing professionals to convert historical maps into spatially accurate digital datasets.
What is Root Mean Square Error (RMSE) in map scaling?
RMSE measures the accuracy of scaled historical maps by calculating the average deviation between known control points and their mapped positions. It’s a statistical tool used in quality control to verify scaling precision and identify areas requiring correction.
How does the Triangulation and Control Point Method work?
This method establishes geometric relationships between multiple known points on historical and modern maps. By creating triangular networks of control points and applying traditional triangulation formulas, cartographers can calculate precise distances and angles while correcting projection distortions.
What are coordinate system transformations in historical map scaling?
Coordinate system transformations include affine and polynomial transformations that correct geometric errors in historical maps. These mathematical processes help align historical maps with modern coordinate systems while preserving geographic relationships and correcting systematic distortions.