6 Ideas for Using Maps for Place-Based Storytelling That Transform Content
Maps aren’t just navigation tools — they’re powerful storytelling devices that can transform how you connect audiences to places and experiences. Whether you’re a content creator journalist or educator you can leverage geographic visualization to make your narratives more compelling and memorable.
Place-based storytelling through maps helps readers visualize complex relationships between locations events and people while creating emotional connections to the spaces where stories unfold. From interactive digital experiences to simple annotated graphics these visual tools can elevate your content and boost engagement across any platform.
Disclosure: As an Amazon Associate, this site earns from qualifying purchases. Thank you!
Transform Historical Events Into Interactive Journey Maps
Interactive journey maps turn static historical narratives into dynamic experiences that let your audience follow events as they unfold across geographic space. You’ll create compelling stories by connecting temporal sequences with their physical locations.
P.S. check out Udemy’s GIS, Mapping & Remote Sensing courses on sale here…
Layer Timeline Elements Over Geographic Locations
Timeline overlays transform your historical maps into chronological narratives that show how events progressed through specific places. You can add date markers, progress bars, and sequential waypoints that guide viewers through campaigns like Lewis and Clark’s expedition or the Underground Railroad routes. Modern mapping platforms like ArcGIS StoryMaps and TimeMapper let you synchronize temporal data with geographic coordinates, creating smooth transitions between historical moments. Consider using color coding to differentiate time periods and animated sequences to show movement patterns across your mapped territory.
Include Primary Source Documents and Archival Photos
Primary sources embedded directly into your interactive maps provide authentic historical context that strengthens your storytelling credibility. You can attach digitized letters, newspaper clippings, government documents, and period photographs to specific geographic points where they were created or referenced. The Library of Congress digital collections and state historical societies offer extensive archives for most US historical events. Position these documents as clickable hotspots or popup windows that appear when users explore different map locations, creating an immersive research experience that connects readers with original historical voices.
Add Audio Narration for Key Historical Moments
Audio elements bring historical figures and events to life through voice acting, period music, and ambient soundscapes tied to specific map locations. You can record dramatic readings of historical speeches, diary entries, or eyewitness accounts that play automatically when users reach designated waypoints on your journey map. Tools like Atavist and ArcGIS Online support embedded audio files with geographic triggers. Consider adding background sounds like battle noise, train whistles, or period-appropriate music to enhance the atmospheric experience and help your audience feel transported to historical moments and places.
Create Character-Driven Story Maps That Follow Personal Journeys
Understand the structure of a one-hour TV drama pilot. This book provides a guide to story mapping for television.

Character-driven story maps transform geographical data into compelling narratives by anchoring spatial information to individual experiences. You’ll create more engaging content when you center your map around a specific person’s journey rather than abstract locations.
Track Character Movement Across Different Locations
Plot your character’s path using GPS coordinates and elevation data to create accurate movement patterns. You can visualize their journey through different terrain types using topographic base layers and trail data from sources like OpenStreetMap. Mark significant waypoints where your character made decisions or encountered obstacles, using different icon styles to represent various types of stops along their route.
Embed Character Development Through Geographic Milestones
Connect your character’s emotional growth to specific geographic features using elevation profiles and landscape analysis. You’ll find that challenging terrain often correlates with personal breakthroughs in your narrative. Use terrain visualization tools to highlight how physical obstacles mirror internal struggles, creating visual metaphors through contour lines, slope analysis, and viewshed mapping that demonstrate your character’s expanding perspective.
Include Personal Artifacts and Diary Entries at Relevant Points
Integrate scanned documents and photographs as pop-up elements tied to precise coordinate locations. You can georeference historical images and handwritten notes using control points and coordinate transformation tools. Layer these personal artifacts over satellite imagery or historical maps to provide authentic context, ensuring proper metadata attribution and file compression for web-based map applications.
Develop Community Memory Maps That Preserve Local Stories
Community memory maps create lasting archives of neighborhood experiences that connect past and present through geographic storytelling. You’ll capture authentic voices and document evolving landscapes while preserving cultural knowledge for future generations.
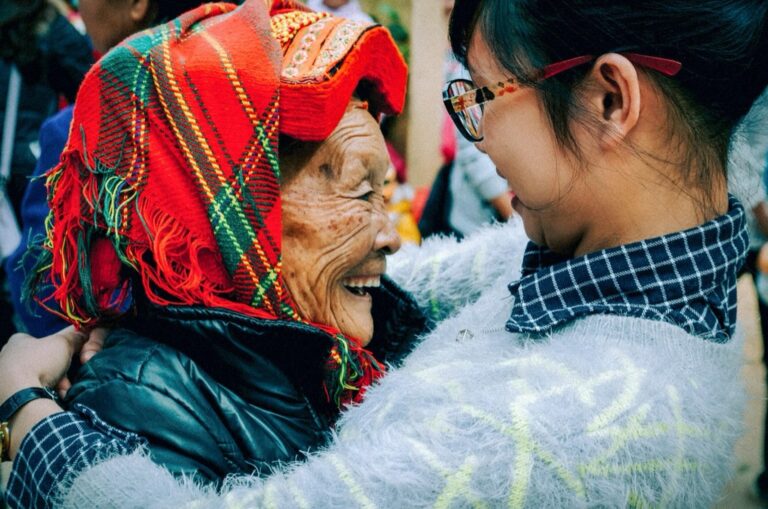
Collect Oral Histories From Long-Time Residents
Interview elderly community members at specific locations where their stories unfolded to create geo-referenced audio recordings. You’ll anchor these personal narratives to exact coordinates using GPS data, allowing listeners to experience stories in their original settings. Document recurring themes across multiple interviews to identify shared community experiences. Record conversations in quiet outdoor spaces or community centers to minimize background noise interference. Create transcripts with timestamp markers that correspond to map waypoints for easier navigation.
Document Changing Neighborhoods Through Time-Lapse Photography
Photograph the same locations at regular intervals using consistent camera angles and GPS coordinates to track neighborhood evolution over months or years. You’ll create visual timelines that show construction projects, seasonal changes, and community development patterns. Use drone photography for aerial perspectives that capture broader neighborhood transformations. Position your camera at identical coordinates using surveying equipment or smartphone GPS to ensure precise alignment between shots. Stack these images in chronological order to demonstrate how places evolve through time.
Get accurate leveling with the KEZERS 32X Optical Level Kit. It features 32X magnification, a self-leveling system, and comes with a tripod and grade rod for easy setup.

Feature Local Landmarks and Their Cultural Significance
Map community gathering spaces, historic buildings, and culturally important sites that residents identify as meaningful to their neighborhood identity. You’ll document stories behind local monuments, murals, and informal meeting places that wouldn’t appear in official tourism guides. Include information about architectural styles, construction dates, and the social functions these landmarks serve in community life. Interview local historians and cultural leaders to understand deeper significance beyond surface appearances. Create detailed descriptions that explain why certain locations hold special meaning for different cultural groups within the neighborhood.
Build Environmental Storytelling Maps That Show Ecological Changes
Environmental storytelling maps reveal the dynamic relationship between human activity and natural systems through geographic visualization. These maps transform complex ecological data into compelling narratives that connect audiences with environmental change across time and space.
Visualize Climate Impact Over Time Through Before-and-After Imagery
Create compelling climate impact maps by overlaying historical satellite imagery with current conditions using platforms like Google Earth Engine or USGS Earth Explorer. You’ll need to synchronize temporal datasets from NASA’s Landsat archive spanning 1972-present to show glacier retreat, deforestation, or urban expansion. Position slider controls on your map interface to let viewers toggle between time periods, creating dramatic visual comparisons. Include temperature and precipitation data overlays from NOAA Climate Data Online to correlate visual changes with measured climate variables.
Track Wildlife Migration Patterns and Habitat Changes
Document wildlife movement using GPS collar data from research institutions combined with habitat loss mapping from IUCN Red List assessments. You can visualize migration corridors using ArcGIS Network Analyst or QGIS processing tools to show how development fragments traditional pathways. Incorporate breeding ground data from eBird or iNaturalist to illustrate seasonal patterns and population changes. Layer vegetation indices from MODIS satellite data to show habitat quality degradation over time, connecting animal movement patterns with environmental pressures.
Keep your dog safe with the Halo Collar 4, a GPS wireless fence and tracker. It uses dual-frequency GPS for accurate location and features customizable boundaries, activity tracking, and extended battery life.

Include Scientific Data Points and Research Findings
Integrate peer-reviewed research findings by geocoding study locations from environmental journals and government reports. You’ll want to create data point symbols that scale based on statistical significance or sample size to show research confidence levels. Include error bars and confidence intervals in your map popups to maintain scientific accuracy. Reference datasets from EPA monitoring stations, university research programs, and citizen science projects to provide authoritative context for your environmental narratives.
Design Cultural Heritage Maps That Celebrate Diverse Traditions
Cultural heritage maps serve as powerful tools for preserving and sharing the rich tapestry of human experiences across geographic spaces. These specialized maps transform abstract cultural data into visual narratives that honor diverse communities and their contributions to local identity.
Highlight Immigration Patterns and Settlement Stories
Immigration patterns reveal fascinating stories of human movement and cultural adaptation across your mapped regions. You’ll find that overlaying census data with historical immigration records creates compelling visualizations of how communities formed and evolved over decades.
Start by collecting ship manifests, naturalization records, and neighborhood demographic data to trace settlement patterns. Plot these data points using different colors or symbols for various ethnic groups, showing how communities clustered around specific landmarks like churches, schools, or industrial sites. Include population density heat maps to illustrate how immigrant neighborhoods expanded or contracted over time periods.
Showcase Traditional Festivals and Cultural Events by Location
Traditional festivals and cultural events provide vibrant markers of community identity that you can effectively map using event scheduling data and geographic coordinates. These celebrations often cluster around specific venues, creating cultural districts that tell stories about local traditions and community values.
Document annual festivals, religious celebrations, and cultural performances by collecting event calendars from community centers, religious organizations, and cultural associations. Use temporal mapping techniques to show how these events cycle throughout the year, creating seasonal patterns of cultural activity. Include photographs and brief descriptions of each celebration to provide context for your mapped locations.
Feature Local Artists, Musicians, and Cultural Contributors
Local artists and cultural contributors create the creative backbone of communities, and their work locations tell stories about cultural hubs and artistic movements. You can map these individuals using studio addresses, performance venues, and public art installations to reveal creative ecosystems within your study area.
Gather information from arts councils, gallery directories, and musician databases to identify key cultural figures and their associated locations. Plot artist studios, music venues, and public art pieces using distinctive symbols that differentiate between various art forms. Include biographical information and examples of their work to create rich, interactive experiences that celebrate local creativity and cultural diversity.
Construct Adventure and Travel Narrative Maps for Immersive Experiences
Adventure maps transform your travel experiences into dynamic storytelling platforms that capture the essence of exploration and discovery. You’ll create immersive narratives that transport readers directly into your journey’s most compelling moments.
Document Real-Time Journey Progress and Daily Discoveries
Track your adventure using GPS coordinates and elevation data to create accurate route visualizations that showcase terrain challenges and scenic highlights. Mark significant waypoints like mountain peaks, river crossings, or unexpected detours that shaped your experience. Embed daily journal entries at specific locations to capture spontaneous discoveries and emotional reactions. Use color-coded route segments to distinguish between different days or activity types, creating a visual timeline of your progress. Add weather data and timestamps to provide context for challenging conditions or perfect moments.
Include Travel Tips and Hidden Gems for Each Location
Anchor practical advice to specific coordinates where you discovered valuable insights or encountered challenges during your journey. Mark locations of reliable water sources, scenic viewpoints, or technical climbing sections with detailed annotations. Include cost information for local services, transportation options, and accommodation recommendations based on your actual experiences. Document seasonal considerations like weather patterns, trail conditions, or wildlife activity that affect timing decisions. Create layered information panels that reveal insider knowledge about permits, local customs, or safety considerations for each mapped location.
Add Multimedia Elements Like Videos and Sound Recordings
Embed short video clips at key geographic points to capture the atmosphere and scale of dramatic landscapes or cultural encounters. Record ambient soundscapes like rushing waterfalls, bird calls, or bustling markets to transport readers into the environment. Include time-lapse photography of sunrise views, weather changes, or camp setups to show temporal progression. Use 360-degree photos at scenic overlooks to provide immersive perspective experiences. Integrate audio narration describing challenging moments or profound realizations tied to specific locations, creating emotional connections between place and personal transformation.
Conclusion
Maps offer endless possibilities for transforming your storytelling from ordinary to extraordinary. Whether you’re documenting personal adventures or preserving community histories these geographic tools help you create deeper connections with your audience.
The beauty of place-based storytelling lies in its versatility. You can start simple with basic location markers and gradually incorporate multimedia elements as your skills develop. Each approach—from historical journeys to environmental narratives—offers unique ways to engage readers and make your content more memorable.
Your stories deserve to be experienced not just read. By anchoring your narratives to real places you’re giving your audience the power to explore and connect with your content on multiple levels. Start experimenting with these mapping techniques today and watch your storytelling reach new heights.
Frequently Asked Questions
What are storytelling maps and how do they enhance content engagement?
Storytelling maps are geographic visualization tools that combine location data with narratives to create compelling, interactive experiences. They enhance engagement by helping audiences understand complex relationships between places, events, and people. Maps transform abstract information into visual narratives, making content more memorable and emotionally resonant across different platforms and media formats.
How can interactive journey maps bring historical narratives to life?
Interactive journey maps transform static historical accounts into dynamic experiences by layering timeline elements over geographic locations. They allow audiences to follow events as they unfold across space and time, using modern mapping platforms to synchronize temporal data with coordinates. Adding primary sources, archival photos, and audio narration creates immersive experiences that connect users with the past.
What makes character-driven story maps more engaging than traditional geographic presentations?
Character-driven story maps anchor spatial information to individual experiences, creating personal connections rather than abstract location data. By tracking a specific person’s journey through GPS coordinates and elevation data, creators can visualize movement through different terrains and mark significant waypoints. Embedding personal artifacts and diary entries adds authentic context and emotional depth to the narrative.
How do community memory maps preserve neighborhood stories and cultural heritage?
Community memory maps serve as lasting archives that connect past and present through geographic storytelling. They collect oral histories from long-time residents using geo-referenced audio recordings anchored to specific locations. Time-lapse photography documents neighborhood changes, while mapping culturally important landmarks preserves local knowledge and enhances community identity for future generations.
What role do environmental storytelling maps play in communicating climate change?
Environmental storytelling maps reveal the dynamic relationship between human activity and natural systems by transforming complex ecological data into compelling narratives. They use historical satellite imagery for before-and-after comparisons of changes like glacier retreat and urban expansion. GPS collar data tracks wildlife migration patterns, while integrated scientific data points maintain accuracy and provide authoritative environmental context.
How can cultural heritage maps celebrate community diversity and traditions?
Cultural heritage maps preserve and share diverse traditions by transforming abstract cultural data into visual narratives. They map immigration patterns using census data and historical records to visualize community evolution. Geographic coordinates showcase traditional festivals and cultural events, while mapping local artists’ work locations reveals creative ecosystems and celebrates the rich diversity within communities.
What elements make adventure and travel narrative maps more immersive?
Adventure and travel narrative maps use real-time GPS coordinates and elevation data to document journey progress, marking significant waypoints and embedding daily journal entries. They include travel tips and hidden gems at specific locations, plus multimedia elements like videos and sound recordings. These features transport readers into the journey experience, making narratives more engaging and relatable.