7 Best Map Projection Methods for Cartography
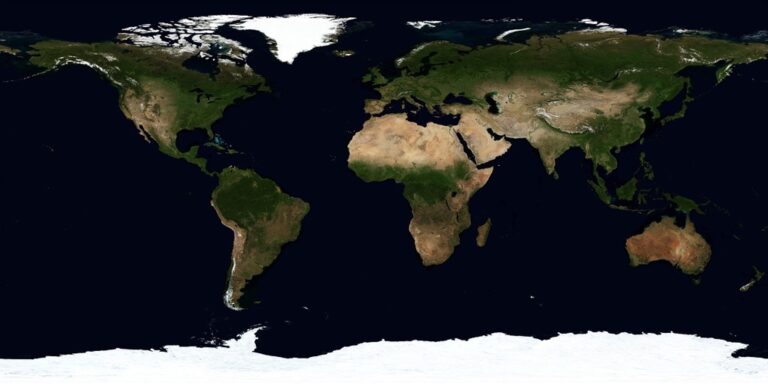
You’ve probably stared at a world map and wondered why Greenland looks massive compared to Africa — even though Africa’s actually 14 times larger. That visual distortion happens because every map projection algorithm faces the impossible challenge of flattening our 3D planet onto a 2D surface without losing critical information.
Whether you’re building navigation apps or analyzing global climate data, choosing the right projection method can make or break your project’s accuracy. The wrong algorithm might compress polar regions beyond recognition or stretch equatorial areas into unrecognizable shapes, leading to costly miscalculations in everything from shipping routes to resource allocation.
Seven proven exploration techniques can help you navigate this complex landscape of projection algorithms, ensuring you select the method that best serves your specific mapping needs while minimizing distortion where it matters most.
Disclosure: As an Amazon Associate, this site earns from qualifying purchases. Thank you!
P.S. check out Udemy’s GIS, Mapping & Remote Sensing courses on sale here…
Understanding the Fundamentals of Map Projection Algorithms
You’ll need to grasp the core mathematical and practical principles that drive projection algorithms before exploring specific methods. This foundation determines how effectively you can evaluate and implement different projection techniques in your mapping projects.
Achieve a flawless, even complexion with e.l.f. Flawless Satin Foundation. This lightweight, vegan formula provides medium coverage and a semi-matte finish for all-day wear, while hydrating your skin with glycerin.

Mathematical Principles Behind Projection Systems
Projection algorithms rely on coordinate transformation equations that convert spherical coordinates (latitude, longitude) into planar coordinates (x, y). You’ll work with three main mathematical approaches: cylindrical projections use trigonometric functions to wrap the Earth around a cylinder, conic projections employ secant or tangent cone geometry, and azimuthal projections project from a single point onto a flat surface.
Scale factors and distortion parameters control how distance, area, and angular relationships change across your map. You’ll calculate these using partial derivatives of the projection equations, with tools like PROJ library providing standardized implementations for over 100 projection types including UTM, State Plane, and Web Mercator systems.
Common Types of Map Projections and Their Applications
Cylindrical projections like Mercator and UTM preserve angles and shapes locally, making them ideal for navigation and web mapping applications. You’ll find Mercator projections in Google Maps and marine charts, while UTM zones provide accurate measurements for surveying and GIS analysis within 6-degree longitude bands.
Learn to navigate confidently with this guide to nautical charts! Understand both electronic and paper charts, including a complete reference to Chart #1 symbols and abbreviations.

Conic projections such as Lambert Conformal Conic and Albers Equal Area work best for mid-latitude regions with east-west extent. You’ll use these for national mapping programs and climate data visualization, as they minimize distortion across countries like the United States and maintain consistent scale along standard parallels.
Interactive Visualization Tools for Algorithm Analysis
Interactive visualization platforms enable you to examine projection algorithms through dynamic interfaces that reveal distortion patterns and mathematical relationships in real-time.
Web-Based Projection Simulators and Platforms
D3.js projection libraries provide comprehensive browser-based testing environments where you can compare multiple algorithms simultaneously. Platforms like Observable notebooks and MapShaper offer immediate visual feedback as you switch between Mercator, Robinson, and Mollweide projections. PROJ.4 JavaScript implementations deliver professional-grade accuracy for testing coordinate transformations. These web tools eliminate software installation requirements while providing access to over 100 projection algorithms with customizable parameters.
Real-Time Parameter Adjustment Features
Dynamic slider controls let you modify central meridians, standard parallels, and scale factors while observing immediate distortion changes across your map display. Modern visualization platforms integrate tissot indicatrix overlays that update automatically as you adjust projection parameters, showing exactly how circular shapes become ellipses. Split-screen comparison modes enable side-by-side algorithm evaluation with synchronized parameter controls. These real-time features help you identify optimal settings for specific geographic regions and mapping objectives.
Comparative Distortion Analysis Techniques
You’ll need systematic methods to evaluate how different projection algorithms affect your map’s accuracy across various geographic regions.
Measuring Angular and Area Distortion Patterns
Angular distortion measurement requires calculating the maximum angular deformation at grid points using Tissot’s indicatrix ellipses. You can visualize these patterns through software like PROJ or GDAL’s projinfo command to generate distortion grids at 1-degree intervals. Area distortion analysis involves computing scale factors using the formula (projected area)/(actual area) and creating heat maps that highlight regions where projections exceed acceptable thresholds. Professional cartographers typically flag areas with >5% distortion for critical applications.
Quantitative Assessment Methods for Accuracy
Root Mean Square Error (RMSE) calculations provide standardized distortion metrics by comparing known coordinates with projected values across test points. You should establish control point networks using at least 50 evenly distributed locations for continental-scale assessments. Statistical validation techniques include computing Pearson correlation coefficients between actual and projected distances, plus generating box plots to identify outliers. Tools like ArcGIS Projection Engine and FME offer automated accuracy reports that calculate distortion statistics across multiple projection parameters simultaneously.
Geographic Information System (GIS) Integration Methods
GIS platforms provide robust testing environments for projection algorithm evaluation through automated workflows and analytical tools.
Open-Source GIS Software for Projection Testing
QGIS offers comprehensive projection testing through its Processing Toolbox with over 50 transformation algorithms. You’ll find built-in distortion analysis tools and the ability to create custom projection definitions using PROJ.4 parameters. GRASS GIS excels at batch processing multiple projections simultaneously through command-line scripts. The software includes specialized modules like r.proj and v.proj for raster and vector transformation testing. PostGIS enables database-level projection comparisons with spatial SQL queries that calculate distortion metrics across geographic regions automatically.
Commercial GIS Platform Capabilities
ArcGIS Pro delivers advanced projection analysis through its Projection Wizard and Model Builder automation tools. You can generate accuracy reports comparing up to 20 projections simultaneously with statistical validation outputs. FME provides enterprise-level projection testing workflows that process thousands of coordinate transformations per minute. The platform includes pre-built templates for distortion heat map generation and coordinate system validation. Global Mapper offers real-time projection switching with instant visual feedback on distortion patterns across different geographic extents and scale ranges.
Programming-Based Algorithm Implementation
Programming environments offer precise control over projection algorithm testing through custom code development and specialized libraries. You’ll gain deeper insights into mathematical transformations while building reusable projection analysis tools.
Python Libraries for Custom Projection Development
Pyproj serves as your primary Python library for projection algorithm development with over 6,000 coordinate reference systems built-in. You can create custom projection definitions using PROJ strings or WKT formats while accessing advanced distortion analysis functions. Cartopy extends matplotlib with geographic projection capabilities, letting you visualize projection effects immediately. GeoPandas integrates seamlessly with these libraries for spatial data manipulation and coordinate transformation testing. NumPy handles the underlying mathematical calculations efficiently, while SciPy provides optimization functions for parameter tuning.
JavaScript Frameworks for Web-Based Exploration
D3-geo delivers comprehensive projection algorithm implementation with over 100 built-in projections and customizable parameters. You can create interactive web applications that demonstrate projection effects in real-time using drag-and-drop functionality. Proj4js handles coordinate transformations between different projection systems with high accuracy. Leaflet combined with projection plugins enables dynamic map switching for comparative analysis. OpenLayers provides robust projection support with advanced geometric calculations. Observable notebooks offer collaborative environments where you can share projection experiments and receive community feedback on algorithm performance.
Historical Case Study Examination Approaches
You’ll gain invaluable insights by studying how legendary cartographers tackled projection challenges throughout history. These examination approaches reveal time-tested solutions that remain relevant for modern algorithm development.
Analyzing Classical Projection Innovations
Mercator’s cylindrical breakthrough revolutionized navigation by preserving angles while accepting area distortion. You can examine his 1569 methodology to understand how he prioritized compass bearing accuracy over land mass representation. Lambert’s equal-area conic projection from 1772 solved area preservation challenges for mid-latitude regions. Peters’ controversial 1974 equal-area projection sparked debates about projection bias that continue today. These innovations demonstrate how cartographers balanced mathematical constraints with practical applications.
Learning From Past Cartographic Challenges
Colonial mapping expeditions revealed critical projection limitations when European cartographers attempted global coverage. You can study how 18th-century surveyors like James Cook addressed coordinate system transitions between hemispheres. The Great Trigonometric Survey of India (1802-1871) documented systematic errors caused by projection mismatches across vast territories. World War II navigation failures highlighted the dangers of inappropriate projection selection for military operations. These historical challenges provide frameworks for identifying potential algorithm weaknesses before implementation.
Collaborative Research and Peer Review Strategies
Building on these foundational exploration methods, you’ll discover that professional collaboration elevates map projection algorithm evaluation beyond individual analysis. Research partnerships and peer review processes validate your findings while uncovering algorithmic limitations you might miss working alone.
Academic Paper Analysis and Methodology Review
Academic research provides the most rigorous testing frameworks for projection algorithm validation. You’ll find comprehensive methodologies in journals like Cartography and Geographic Information Science and The Cartographic Journal that detail systematic approaches to distortion measurement and accuracy assessment.
Review recent publications from researchers at institutions like the University of Wisconsin’s Cartography Lab and Ohio State’s Department of Geography, where scholars regularly publish projection algorithm comparisons. These papers often include statistical validation methods, control point networks, and reproducible testing procedures that you can adapt for your own evaluation projects.
Professional Cartographer Community Engagement
Connect with professional cartography organizations to access collective expertise and standardized testing protocols. The North American Cartographic Information Society (NACIS) and International Cartographic Association (ICA) maintain active forums where experienced cartographers share projection algorithm insights and real-world performance data.
Participate in annual conferences like AutoCarto and ICC sessions focused on coordinate systems and projections. You’ll gain access to unpublished research, beta testing opportunities for new algorithms, and collaborative projects that benchmark projection performance across different geographic regions and mapping applications.
Conclusion
Mastering these seven exploration methods transforms your approach to projection algorithm selection from guesswork into strategic decision-making. You’ll discover that combining interactive visualization with quantitative analysis yields the most reliable results for your specific mapping needs.
The journey through historical case studies and modern programming tools equips you with both theoretical foundation and practical implementation skills. You’re now positioned to leverage professional networks and peer collaboration to validate your projection choices before deployment.
Your success in projection algorithm exploration depends on systematic application of these techniques rather than relying on single methods. Remember that the best projection algorithm isn’t universal—it’s the one that serves your geographic region and analytical objectives with minimal compromise.
Frequently Asked Questions
What is map projection and why does it cause distortion?
Map projection is the process of representing the 3D Earth on a 2D surface. Distortion occurs because it’s mathematically impossible to flatten a sphere without stretching, compressing, or tearing some areas. This leads to inaccuracies in distance, area, shape, or direction depending on the projection method used.
What are the three main types of map projections?
The three main types are cylindrical projections (like Mercator, ideal for navigation), conic projections (like Lambert Conformal Conic, suited for mid-latitude regions), and azimuthal projections. Each type has specific mathematical approaches and is optimized for different geographic regions and mapping purposes.
How can I choose the right projection for my mapping project?
Select based on your geographic region, intended use, and what properties you need to preserve. For navigation, use Mercator; for climate data in mid-latitudes, consider conic projections. Use interactive visualization tools and comparative analysis to test different algorithms before making your final decision.
What tools are available for testing map projection algorithms?
Interactive web-based tools include D3.js libraries, Observable notebooks, and MapShaper for real-time comparisons. GIS software like QGIS, ArcGIS Pro, and GRASS GIS provide comprehensive testing environments. Programming libraries like Pyproj (Python) and D3-geo (JavaScript) offer custom development capabilities.
How do I measure distortion in map projections?
Use Tissot’s indicatrix ellipses for angular distortion measurement and scale factor calculations for area distortion analysis. Create heat maps to visualize distortion patterns and apply quantitative methods like Root Mean Square Error (RMSE) calculations to assess accuracy across different geographic regions.
What is the importance of historical case studies in projection selection?
Historical examples like Mercator’s cylindrical projection and Lambert’s equal-area conic reveal how past cartographers solved specific challenges. Learning from colonial mapping expeditions and surveys like the Great Trigonometric Survey of India helps identify potential weaknesses in modern algorithms before implementation.
Can GIS software help with projection algorithm evaluation?
Yes, GIS platforms provide robust testing environments with automated workflows and analytical tools. Open-source options like QGIS and GRASS GIS offer built-in distortion analysis, while commercial platforms like ArcGIS Pro generate detailed accuracy reports and process thousands of coordinate transformations efficiently.