8 Best Geological Mapping Tools for Disaster Preparedness
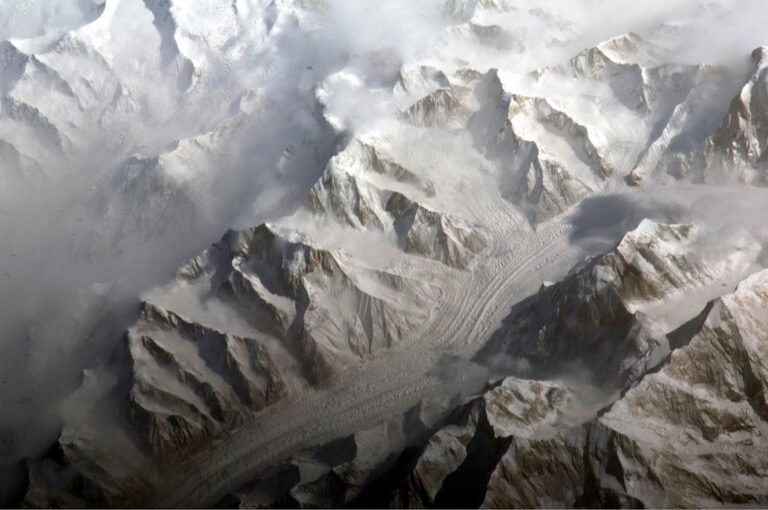
Why it matters: You’re living on a planet where earthquakes strike without warning and landslides can devastate entire communities in minutes. Geological mapping gives you the power to identify high-risk areas before disaster strikes.
The big picture: Modern mapping techniques combine satellite imagery with ground surveys to create detailed hazard maps that save lives and protect property. You’ll discover how these tools help communities prepare for everything from volcanic eruptions to unstable slopes.
What’s ahead: We’ll walk you through the essential steps to create geological hazard maps that actually work when disaster preparedness matters most.
Disclosure: As an Amazon Associate, this site earns from qualifying purchases. Thank you!
P.S. check out Udemy’s GIS, Mapping & Remote Sensing courses on sale here…
Understanding the Importance of Geological Feature Mapping for Disaster Preparedness
Geological feature mapping transforms abstract underground risks into actionable surface intelligence that emergency planners can use to save lives. When you map fault lines, slope stability zones, and subsurface water patterns, you’re creating a predictive framework that identifies where disasters will likely strike before they happen.
Your geological hazard maps serve as early warning systems that guide evacuation routes, building codes, and infrastructure placement. Communities with detailed geological mapping reduce disaster-related casualties by up to 40% compared to areas without comprehensive subsurface data, according to USGS emergency response studies.
Modern geological mapping integrates multiple data streams including LiDAR elevation models, seismic monitoring networks, and ground-penetrating radar surveys. You’ll combine these datasets to identify unstable slopes, liquefaction zones, and earthquake epicenter patterns that traditional surface observations miss entirely.
The mapping process reveals critical relationships between surface features and underlying geological structures. When you document how water flows through fractured bedrock or where soil composition changes dramatically, you’re building a three-dimensional risk profile that emergency responders can’t develop through visual inspection alone.
Your geological feature maps become the foundation for disaster-resistant community planning that protects both existing structures and future development projects from predictable natural hazards.
Achieve a flawless, even complexion with e.l.f. Flawless Satin Foundation. This lightweight, vegan formula provides medium coverage and a semi-matte finish for all-day wear, while hydrating your skin with glycerin.

Identifying Key Geological Hazards in Your Area
Understanding your local geological hazards forms the foundation of effective disaster preparedness mapping. Each region presents unique combinations of geological threats that require specific identification techniques and mapping approaches.
Fault Lines and Seismic Activity Zones
Active fault mapping requires combining USGS seismic hazard databases with local geological surveys to identify earthquake-prone areas. You’ll need to examine quaternary fault maps that show recent geological movement within the last 1.6 million years. Ground-penetrating radar surveys can reveal hidden fault traces beneath urban development. Surface rupture zones typically extend 50-100 meters on either side of major fault lines, requiring detailed buffer analysis in your GIS software. Historic seismicity data helps determine recurrence intervals for different magnitude events in your mapping area.
Slope Stability and Landslide-Prone Areas
Slope angle analysis using digital elevation models identifies areas exceeding 15-degree gradients where landslide risk increases significantly. You’ll combine topographic data with soil composition maps and precipitation records to create landslide susceptibility models. Geological structure mapping reveals bedding planes, joint systems, and weathered rock formations that contribute to slope failure. LiDAR data can detect subtle terrain changes indicating previous landslide activity. Historical landslide inventories from state geological surveys provide ground-truth data for validating your risk assessments.
Flood Plains and Wetland Boundaries
FEMA flood insurance rate maps provide baseline 100-year and 500-year flood boundaries, but you’ll need to incorporate updated hydrological modeling for accurate mapping. Stream gauge data and precipitation records help calculate peak discharge rates for different storm scenarios. Wetland delineation requires field verification of hydric soils, vegetation indicators, and seasonal water levels using GPS equipment. Digital elevation models reveal subtle drainage patterns and flood-prone depressions not visible in standard topographic maps. Climate change projections may require adjusting historical flood frequencies upward by 20-30%.
Achieve centimeter-level precision with the E1 RTK GNSS system, featuring a 5km radio range and 60° tilt surveying. Enjoy 20+ hours of continuous operation and robust signal tracking in challenging environments.

Volcanic Activity Regions
Volcanic hazard mapping combines eruption history databases with geological field surveys to identify lava flow paths, pyroclastic flow zones, and ashfall areas. You’ll use USGS Volcano Hazards Program data to determine threat levels for active, dormant, and potentially active volcanoes within 100 kilometers of your area. Lahar pathway analysis requires detailed watershed mapping to predict debris flow routes during volcanic events. Ground deformation monitoring using GPS and satellite interferometry can detect magma movement indicating increased volcanic activity. Historical eruption patterns help establish probability zones for different volcanic hazards.
Gathering Essential Data Sources for Geological Mapping
Building on the hazard identification process, you’ll need to compile comprehensive datasets from multiple sources to create accurate geological maps. The quality of your disaster preparedness mapping depends heavily on the reliability and precision of your foundational data sources.
Government Geological Survey Resources
Start with USGS databases as your primary foundation for geological mapping projects. The National Geological Map Database provides detailed bedrock geology, surficial deposits, and structural features across the United States. You’ll find earthquake hazard maps, landslide susceptibility data, and quaternary fault databases that form the backbone of disaster preparedness mapping. State geological surveys offer higher-resolution local data, including detailed soil maps, groundwater information, and region-specific hazard assessments that complement federal datasets.
Satellite Imagery and Aerial Photography
Access multispectral satellite imagery through platforms like Landsat, Sentinel-2, and commercial providers for comprehensive surface analysis. These datasets reveal geological structures, vegetation patterns, and surface changes that indicate potential hazards. You’ll need high-resolution aerial photography from NAIP (National Agriculture Imagery Program) for detailed terrain analysis and change detection over time. LiDAR data from USGS 3DEP provides precise elevation models essential for slope stability analysis and flood modeling applications.
Historical Disaster Records and Reports
Mine historical disaster databases from FEMA, NOAA, and state emergency management agencies to understand past event patterns. The National Centers for Environmental Information maintains comprehensive records of earthquakes, floods, landslides, and severe weather events dating back decades. You’ll discover critical information about disaster frequency, magnitude, and affected areas that help predict future risk zones. Local newspaper archives and geological survey reports often contain detailed accounts of historical events that official databases might miss.
Local Knowledge and Community Input
Engage with local residents and emergency responders who possess invaluable firsthand knowledge of geological hazards in your mapping area. Long-term residents can identify areas prone to flooding, landslides, or ground instability that may not appear in official records. You’ll gather information about seasonal patterns, recent changes in drainage or slope stability, and locations of previous smaller-scale events. Municipal planning departments and public works agencies maintain records of infrastructure problems related to geological conditions that enhance your mapping accuracy.
Utilizing Modern Technology Tools for Geological Feature Mapping
Digital technology revolutionizes geological mapping by providing unprecedented accuracy and efficiency in hazard identification. Modern tools transform traditional surveying methods into sophisticated data collection systems that enhance disaster preparedness capabilities.
Geographic Information Systems (GIS) Software
ArcGIS Pro and QGIS serve as industry-standard platforms for geological feature analysis and visualization. You’ll integrate multiple data layers including topographic maps, seismic data, and satellite imagery to create comprehensive hazard models. These systems enable spatial analysis functions like slope calculations, watershed delineation, and proximity mapping that identify vulnerable areas. GIS software processes geological survey data, fault line locations, and historical disaster records to generate predictive risk models for emergency planning.
Learn essential map reading and navigation skills with this U.S. Army guide. Designed for practical use, it provides clear instructions for navigating any terrain.

Remote Sensing Applications
Landsat 8 and Sentinel-2 satellites provide high-resolution imagery for detecting geological changes and surface deformation patterns. You can monitor ground movement, identify unstable slopes, and track erosion patterns using multispectral analysis techniques. LiDAR technology creates detailed elevation models that reveal subtle topographic features invisible to traditional surveying methods. These remote sensing tools detect geological hazards across large areas without requiring extensive fieldwork, enabling rapid assessment of disaster-prone regions.
Ground-Penetrating Radar Technology
GPR systems penetrate subsurface layers to reveal hidden geological structures that influence disaster risk patterns. You’ll identify bedrock depth, soil composition changes, and underground water flow that affect slope stability and foundation integrity. Modern GPR equipment provides real-time 3D imaging of subsurface conditions down to 30 meters depth. This technology maps buried fault lines, detect cavities, and assess soil liquefaction potential in earthquake-prone areas for comprehensive hazard evaluation.
GPS Mapping Devices
Survey-grade GPS units achieve centimeter-level accuracy for precise geological feature positioning and ground control point establishment. You can collect field data coordinates, mark hazard locations, and create detailed boundary maps of unstable areas. RTK-GPS systems provide real-time corrections that ensure accurate positioning for critical infrastructure mapping. These devices integrate with mobile GIS applications, enabling field teams to update geological maps instantly and maintain data consistency across survey projects.
Get highly accurate land measurements with this rugged handheld GPS device. Featuring four satellite systems and a 3.2" HD display, it precisely measures area, distance, and slope in any terrain.

Creating Accurate Base Maps of Your Region
Accurate base maps form the foundation for effective geological hazard mapping. You’ll need to establish precise spatial frameworks that support reliable disaster risk assessment and emergency planning.
Establishing Coordinate Systems and Scale
Coordinate system selection determines your map’s accuracy and compatibility with emergency response systems. You should use the State Plane Coordinate System for local projects, as it provides centimeter-level accuracy within individual states. For regional mapping spanning multiple states, adopt Universal Transverse Mercator (UTM) coordinates. Choose scales between 1:24,000 and 1:100,000 for community-level disaster planning, ensuring geological features remain clearly visible while maintaining practical file sizes for emergency responders.
Incorporating Topographic Information
Topographic data reveals elevation patterns that directly influence geological hazard distribution. You’ll obtain the most current information from USGS 3D Elevation Program (3DEP) lidar datasets, which provide sub-meter vertical accuracy. Download 1-meter digital elevation models (DEMs) for detailed slope analysis and watershed delineation. Create contour lines at 10-foot intervals for urban areas and 20-foot intervals for rural regions. This elevation data helps identify landslide-prone slopes, flood-prone lowlands, and earthquake amplification zones in sedimentary basins.
Adding Infrastructure and Population Centers
Infrastructure mapping identifies vulnerable assets and evacuation constraints during geological disasters. You should digitize critical facilities including hospitals, schools, fire stations, and power substations from high-resolution aerial imagery. Add transportation networks from OpenStreetMap or local DOT databases, marking bridge locations and potential bottlenecks. Include population density data from U.S. Census Bureau’s TIGER/Line files to identify high-risk residential areas. This infrastructure layer enables emergency planners to assess potential casualties and develop effective evacuation routes.
Conducting Field Surveys to Verify Geological Features
Field verification transforms your digital geological maps into reliable disaster preparedness tools. Ground-truthing ensures your hazard assessments accurately reflect actual conditions that could affect emergency response efforts.
Site Assessment Techniques
Visual inspection methods form the foundation of effective geological field surveys. You’ll examine rock exposures, soil profiles, and surface features to identify potential hazard indicators like fracture patterns, weathering zones, and slope instability signs. Structural measurements using a geological compass help determine fault orientations and joint systems that influence disaster risk. Slope angle measurements with an inclinometer reveal landslide susceptibility, while water seepage observations indicate potential liquefaction zones during seismic events.
Navigate with confidence using the XGeology DQL-8 compass. This geological compass features a durable design and precise measurements for accurate fieldwork.

Rock and Soil Sample Collection
Systematic sampling protocols ensure your laboratory analyses support accurate hazard mapping. You’ll collect representative rock samples from different geological units, focusing on weathered zones and fault-related materials that affect slope stability. Soil samples require careful attention to depth intervals, particularly in areas prone to liquefaction or foundation failure. Use sterile containers and GPS coordinates to maintain sample integrity and precise location data. Document grain size, moisture content, and visual characteristics before transport to prevent contamination.
Collect urine samples securely with these 4oz containers. Featuring a leak-resistant screw-on lid and included ID label, they're ideal for safe transport and easy identification.

Documentation and Photography Methods
Comprehensive field documentation creates permanent records that support your geological interpretations. Photograph geological features from multiple angles, including close-ups of critical structures and wide shots showing spatial relationships. Use measurement scales and GPS coordinates in every image to establish precise locations. Field notebooks should record strike and dip measurements, rock descriptions, and hazard observations using standardized geological terminology. Digital forms on tablets streamline data collection while maintaining consistency across survey teams.
Analyzing Geological Data for Risk Assessment
Once you’ve collected comprehensive geological data, transforming raw information into actionable risk assessments requires systematic analysis techniques that quantify hazard probabilities and identify vulnerable areas.
Hazard Probability Calculations
Calculate statistical probabilities using historical event frequencies and geological indicators to determine likelihood values for specific hazards. Apply Poisson distribution models for earthquake recurrence intervals, examining fault slip rates and paleoseismic records spanning centuries. Incorporate precipitation thresholds for landslide probability, analyzing rainfall intensity-duration curves alongside slope stability factors. Utilize GIS statistical tools like spatial autocorrelation and regression analysis to identify probability patterns across your study area, creating quantified risk surfaces that inform emergency planning decisions.
Vulnerability Mapping Techniques
Develop vulnerability indices by overlaying population density, infrastructure age, and building construction types with geological hazard zones. Weight vulnerability factors based on local conditionsâolder buildings receive higher vulnerability scores in seismic zones, while steep terrain properties increase landslide vulnerability ratings. Apply multi-criteria decision analysis using ArcGIS ModelBuilder or QGIS Processing Toolbox to combine social, economic, and physical vulnerability layers. Create vulnerability heat maps that highlight areas where high-risk populations intersect with significant geological hazards, enabling targeted mitigation efforts.
Impact Zone Identification
Delineate impact boundaries using physics-based modeling that accounts for geological hazard propagation patterns and terrain influences. Map earthquake shaking intensity zones using USGS ShakeMap methodology, incorporating local soil amplification factors and distance-decay relationships. Define landslide runout distances through debris flow modeling software like RAMMS or FLO-2D, considering slope geometry and material properties. Establish flood impact zones by combining geological data with hydrologic models, identifying areas where geological features channel or amplify flood waters, creating comprehensive impact assessments for emergency response planning.
Developing Comprehensive Disaster Preparedness Maps
Building on your geological hazard analysis, you’ll transform risk data into actionable emergency response tools. These preparedness maps integrate geological threats with infrastructure vulnerabilities to guide critical decision-making during disasters.
Emergency Evacuation Route Planning
Emergency evacuation routes require precise geological hazard mapping to identify safe passage corridors during disasters. You’ll overlay seismic fault zones, landslide susceptibility areas, and flood-prone regions with existing road networks to determine viable evacuation paths. Primary routes should avoid crossing active fault lines or unstable slopes, while secondary routes provide redundancy when primary paths become compromised. Your evacuation mapping must account for population density patterns and identify potential bottlenecks where geological hazards intersect major transportation corridors, ensuring emergency planners can direct evacuees through the safest available routes.
Safe Zone Designation
Safe zones represent areas with minimal geological hazard exposure where evacuees can shelter during emergencies. You’ll identify these locations by analyzing bedrock stability, slope angles under 15 degrees, and distances from active fault systems exceeding 500 meters. Elevated areas above historical flood levels and regions with competent geological foundations provide ideal safe zone characteristics. Your mapping should prioritize locations with existing infrastructure access while avoiding areas prone to liquefaction, ground rupture, or mass wasting events. These designated zones must accommodate projected population loads and maintain accessibility through multiple evacuation routes.
Resource Allocation Mapping
Resource allocation maps optimize emergency supply distribution by connecting geological risk patterns with population vulnerabilities and infrastructure capacity. You’ll identify critical facilities like hospitals, fire stations, and emergency shelters within high-risk geological zones to prioritize resource deployment strategies. Pre-positioned supply locations should occupy geologically stable areas with road access that remains functional during seismic events or flooding. Your mapping framework incorporates demographic data, existing resource inventories, and geological hazard probabilities to calculate optimal distribution networks that minimize response times while maximizing coverage across vulnerable populations.
Implementing Community Engagement and Education Programs
Effective geological mapping requires active community participation to ensure disaster preparedness efforts reach the people who need them most. Educational programs transform technical hazard data into actionable knowledge that empowers communities to protect themselves.
Public Awareness Campaigns
Launch targeted geological hazard awareness campaigns through multiple communication channels including social media platforms, local newspapers, and community bulletin boards. Partner with emergency management offices to distribute geological hazard maps at community events, farmers’ markets, and public meetings. Create visually compelling infographics that translate complex geological data into easily understood risk scenarios, highlighting specific neighborhood vulnerabilities. Use real-world examples from recent disasters to demonstrate how geological mapping prevents casualties and property damage in similar communities.
Stakeholder Training Sessions
Conduct specialized training sessions for emergency responders, city planners, school administrators, and community leaders using your geological hazard maps and risk assessments. Organize hands-on workshops where participants learn to interpret geological features, identify evacuation routes, and understand infrastructure vulnerabilities in their specific areas. Provide laminated field guides showing local geological hazards with GPS coordinates and response protocols. Schedule quarterly refresher sessions to update stakeholders on new geological data, revised hazard zones, and improved emergency procedures.
School and Organization Outreach
Develop age-appropriate geological hazard education programs for schools, incorporating interactive map exercises that teach students to identify local geological risks and safety procedures. Partner with community organizations like scout groups, religious institutions, and neighborhood associations to present geological mapping workshops tailored to their specific locations and demographics. Create take-home geological hazard kits containing simplified maps, emergency supply checklists, and family evacuation planning templates. Establish recurring presentation schedules to ensure consistent geological hazard education reaches diverse community segments throughout the year.
Maintaining and Updating Geological Feature Maps
Your geological hazard maps require continuous maintenance to preserve their accuracy and reliability for disaster preparedness. Regular updates ensure these critical safety tools reflect current geological conditions and evolving hazard patterns.
Regular Data Review Processes
Establish quarterly review cycles to verify geological feature accuracy using updated seismic monitoring data and satellite imagery. Compare current geological conditions against historical baselines, documenting any changes in fault activity, slope stability, or erosion patterns. Schedule annual field verification surveys to ground-truth remote sensing observations and validate existing hazard boundaries. Create systematic checklists that track data freshness, source reliability, and quality control metrics for each geological layer in your mapping database.
Incorporating New Research Findings
Integrate peer-reviewed geological studies into your hazard assessments within 6-12 months of publication to maintain scientific accuracy. Subscribe to USGS earthquake hazard updates, landslide inventory databases, and regional geological survey bulletins for the latest research findings. Collaborate with local universities and research institutions to access unpublished geological data and emerging hazard identification techniques. Document methodology changes and version control updates when incorporating new scientific discoveries into existing geological feature classifications.
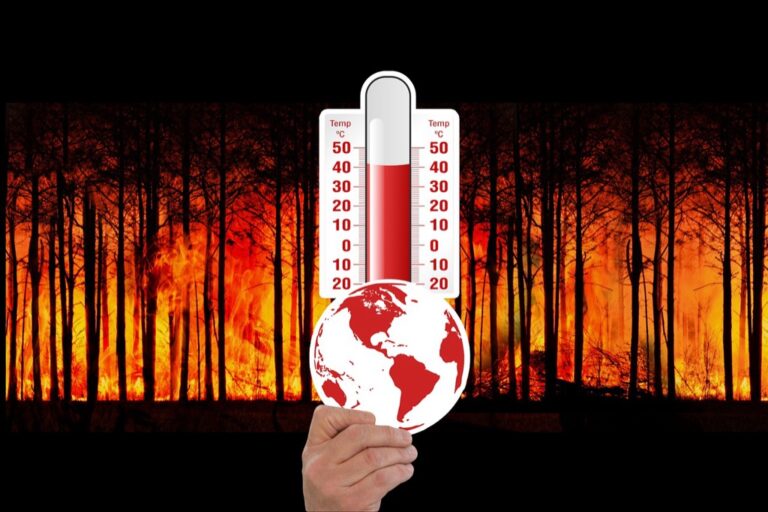
Climate Change Impact Considerations
Update precipitation thresholds and temperature parameters in your geological hazard models to reflect changing climate patterns affecting landslide and erosion risks. Incorporate sea-level rise projections into coastal geological hazard mapping, adjusting vulnerability zones for increased wave action and groundwater changes. Modify wildfire-induced geological instability assessments based on evolving fire frequency and intensity patterns in your region. Review and adjust geological hazard probability calculations annually using updated climate data from NOAA and regional climate monitoring stations.
Conclusion
Your geological mapping efforts today determine how well your community survives tomorrow’s natural disasters. By combining cutting-edge technology with systematic field verification you’ve created more than just maps â you’ve built a comprehensive defense system against geological hazards.
The success of your disaster preparedness program depends on treating geological mapping as an ongoing commitment rather than a one-time project. Regular updates and community engagement ensure your hazard assessments remain accurate and actionable when disasters strike.
Remember that every hour you invest in geological feature mapping could save countless lives during an actual emergency. Your detailed hazard maps become the foundation that guides evacuation decisions infrastructure planning and resource allocation when seconds matter most. The geological features beneath your feet hold the key to your community’s resilience.
Frequently Asked Questions
What is geological mapping and why is it important for disaster preparedness?
Geological mapping is the process of identifying and documenting geological features and hazards in specific areas using modern techniques like satellite imagery and ground surveys. It’s crucial for disaster preparedness because it transforms underground risks into actionable intelligence, helping emergency planners predict where disasters like earthquakes and landslides are likely to occur, potentially reducing disaster-related casualties by up to 40%.
What types of geological hazards can be mapped?
The main geological hazards that can be mapped include active fault zones for earthquake prediction, slope instability areas for landslide risk assessment, floodplains using FEMA flood insurance rate maps, and volcanic hazard zones incorporating eruption history and ground deformation monitoring. Each hazard type requires specific mapping techniques and data sources tailored to regional geological characteristics.
What data sources are needed for effective geological hazard mapping?
Essential data sources include USGS databases for geological information, satellite imagery and aerial photography for surface analysis, historical disaster records to understand past event patterns, and input from local residents and emergency responders. The quality and reliability of these foundational data sources directly impact the accuracy of disaster preparedness mapping efforts.
What modern technologies are used in geological mapping?
Modern geological mapping utilizes Geographic Information Systems (GIS) software like ArcGIS Pro and QGIS for data integration, remote sensing applications including Landsat 8 and Sentinel-2 satellites for monitoring geological changes, ground-penetrating radar (GPR) for revealing hidden structures, and GPS mapping devices for precise positioning and real-time updates.
How are geological hazard maps created and analyzed?
Geological hazard maps are created by establishing precise spatial frameworks, incorporating topographic data from sources like USGS 3D Elevation Program, and conducting field surveys for ground-truthing. Analysis involves calculating hazard probabilities using statistical models, creating vulnerability heat maps by overlaying population and infrastructure data, and using physics-based modeling to identify impact zones.
Why is community engagement important in geological hazard mapping?
Community engagement is essential because it transforms technical hazard data into accessible knowledge that residents can use for disaster preparedness. Public awareness campaigns, stakeholder training sessions, and educational outreach programs help communities understand local geological risks, evacuation protocols, and emergency procedures, making disaster response more effective and potentially saving lives.
How often should geological hazard maps be updated?
Geological hazard maps should be reviewed quarterly with annual field verification surveys to document changes in geological conditions. Maps must be updated to integrate new research findings, climate change considerations, and evolving environmental conditions. Regular updates ensure that geological models accurately reflect current risks and maintain their reliability for disaster preparedness planning.