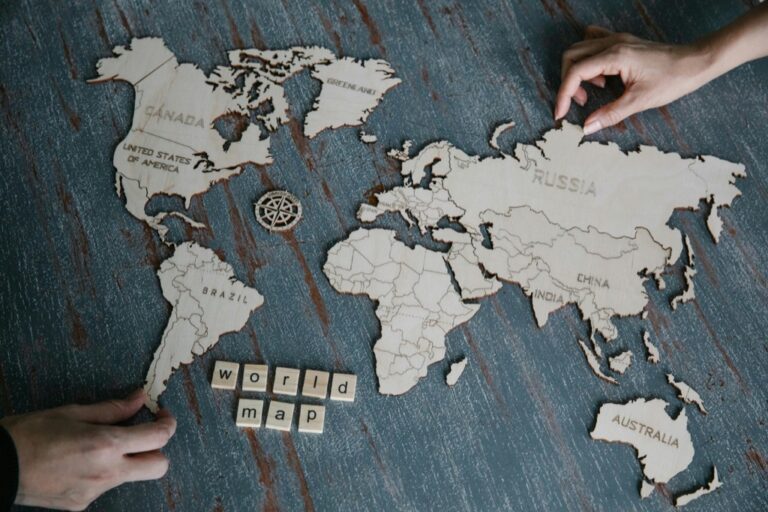
7 Ideas for Creating Maps for Educational Purposes That Transform Learning
Why it matters: Maps aren’t just navigation toolsâthey’re powerful educational resources that transform abstract concepts into visual learning experiences your students will actually remember.
The big picture: Whether you’re teaching geography, history, science, or even literature, custom educational maps help students grasp complex relationships between places, events, and ideas in ways traditional textbooks simply can’t match.
What’s ahead: We’ll explore seven practical mapping strategies that’ll revolutionize how you present information, from interactive digital maps that boost engagement to hands-on projects that turn your classroom into a geography lab.
Disclosure: As an Amazon Associate, this site earns from qualifying purchases. Thank you!
P.S. check out Udemy’s GIS, Mapping & Remote Sensing courses on sale here…
Create Interactive Digital Maps for Geography Lessons
Interactive digital maps transform geography education by allowing students to explore geographic concepts dynamically and engage with spatial data in real-time. These powerful tools enable hands-on learning experiences that traditional paper maps simply can’t match.
Use Online Mapping Tools Like Google Earth
Google Earth provides an exceptional platform for creating immersive geography lessons with its three-dimensional satellite imagery and historical timeline features. You can guide students through virtual field trips to explore landforms, climate zones, and urban development patterns across different time periods. The platform’s measurement tools allow students to calculate distances, areas, and elevations while examining real-world geographic features. Layer historical imagery to demonstrate changes in landscapes, deforestation patterns, or urban expansion over decades.
Incorporate Real-Time Data and Satellite Imagery
Real-time data integration brings current events and dynamic geographic processes directly into your classroom through live weather patterns, natural disaster tracking, and environmental monitoring. You can overlay current satellite imagery with data feeds showing temperature variations, precipitation levels, or air quality measurements to demonstrate geographic concepts in action. NASA’s Worldview and NOAA’s satellite services provide high-resolution imagery updated daily, allowing students to observe volcanic eruptions, hurricane formations, or seasonal changes as they occur.
Add Multimedia Elements and Virtual Tours
Multimedia-enhanced maps create rich educational experiences by embedding videos, photographs, audio recordings, and 360-degree street views directly into geographic locations. You can attach documentary clips about specific regions, local music samples, or historical photographs to relevant map points, creating immersive cultural geography lessons. Virtual tours through platforms like Google Street View allow students to “walk” through different environments, from Amazon rainforests to Arctic tundra, while discussing climate adaptations and human-environment interactions.
Design Historical Timeline Maps for Social Studies
Timeline maps transform abstract historical concepts into visual narratives that students can follow across space and time. You’ll create powerful learning tools that show how civilizations evolved, borders shifted, and people moved throughout history.
Map Ancient Civilizations and Trade Routes
You can illustrate the rise and fall of empires like Rome, Persia, and Egypt by showing their territorial expansion over centuries. Create layered maps that reveal how trade networks like the Silk Road connected distant civilizations and facilitated cultural exchange. Use different colors and line weights to distinguish between land routes, sea routes, and territorial boundaries. Add time sliders to show how these networks evolved, demonstrating how geography shaped economic relationships between ancient societies.
Show Political Boundaries Throughout Different Eras
You’ll help students understand how modern nations emerged by mapping changing political boundaries across specific time periods. Create comparative maps showing Europe before and after major wars, or display how colonial empires carved up continents like Africa and Asia. Use distinct color schemes for different time periods and include clear legends that identify ruling powers. Layer historical boundary data over current political maps to show dramatic territorial changes that shaped today’s world.
Illustrate Migration Patterns and Historical Events
You can trace human movement patterns that shaped civilizations by mapping major migrations like the Great Migration in the United States or the movement of peoples during the Bronze Age collapse. Show how natural disasters, wars, and economic opportunities drove population shifts across continents. Use arrow symbols and flow lines to indicate direction and volume of movement, while adding timeline markers that connect migration events to their historical causes and consequences.
Develop Subject-Specific Thematic Maps for Science Classes
Transform scientific concepts into visual learning experiences by creating thematic maps that illustrate natural phenomena and environmental systems. These specialized maps help students understand complex scientific relationships through spatial representation.
Create Climate and Weather Pattern Maps
Build climate maps using NOAA’s climate data explorer and WorldClim temperature datasets to show precipitation patterns, temperature zones, and seasonal variations. Layer different climate variables like humidity, wind patterns, and atmospheric pressure to create comprehensive weather system visualizations. Include real-time weather station data from weather.gov APIs to demonstrate current conditions alongside historical climate averages. Use color gradients and isoline mapping techniques to represent temperature changes and precipitation levels across different geographic regions.
Get real-time weather data with the Ambient Weather WS-2902. This WiFi-enabled station measures wind, temperature, humidity, rainfall, UV, and solar radiation, plus it connects to smart home devices and the Ambient Weather Network.

Map Biodiversity and Ecosystem Distribution
Develop ecosystem maps using GBIF biodiversity data and NASA’s Earth Observing System to showcase species distribution patterns and habitat ranges. Plot endangered species locations alongside protected area boundaries using IUCN Red List data and UNEP-WCMC protected area databases. Create biome classification maps that highlight different ecological zones like tropical rainforests, grasslands, and marine ecosystems. Incorporate vegetation indices from satellite imagery to show seasonal changes in plant coverage and ecosystem health indicators.
Visualize Geological Features and Natural Resources
Design geological maps using USGS mineral resource databases and geological survey data to display rock formations, fault lines, and mineral deposits. Map natural hazard zones including earthquake epicenters from USGS earthquake catalogs and volcanic activity patterns from the Smithsonian’s Global Volcanism Program. Show resource extraction sites alongside topographic features using digital elevation models from NASA’s SRTM data. Include cross-sectional views and 3D terrain visualization to help students understand subsurface geological structures and formation processes.
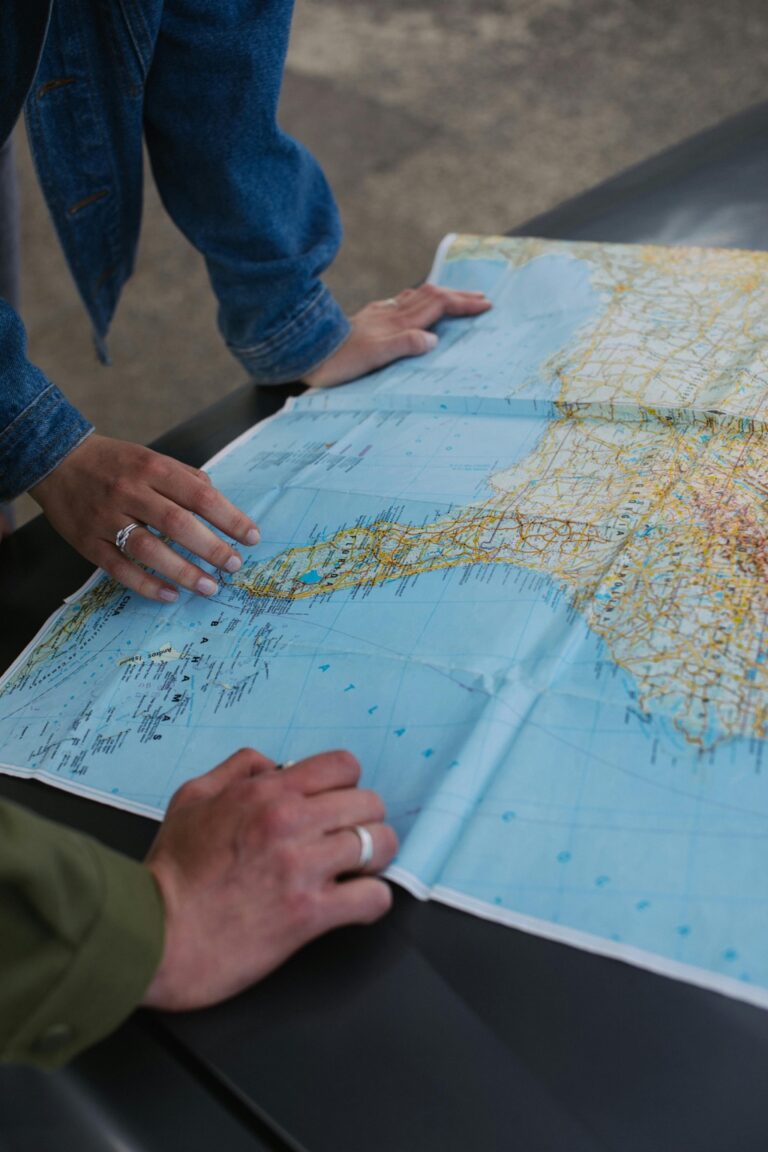
Build Community and Local Area Maps for Civic Education
Community mapping projects transform abstract civic concepts into tangible learning experiences that connect students directly to their local environment. These educational mapping initiatives help students understand how government services, community resources, and neighborhood demographics shape their daily lives.
Map Local Government Buildings and Services
Government building mapping creates visual connections between civic functions and physical locations in your community. You’ll want to identify city hall, county courthouse, police stations, fire departments, and public libraries using GPS coordinates and municipal databases. Students can plot these locations while researching each facility’s specific services, operating hours, and contact information. This mapping exercise demonstrates how local government infrastructure supports community needs and helps students understand the accessibility of public services across different neighborhoods.
Identify Community Resources and Landmarks
Community resource mapping reveals the social infrastructure that supports neighborhood life and cultural identity. You should catalog healthcare facilities, community centers, places of worship, educational institutions, and recreational areas using field surveys and online directories. Students can document accessibility features, service populations, and historical significance of each landmark while creating comprehensive resource inventories. This approach highlights how community assets distribute across geographic areas and identifies potential service gaps or areas of concentrated resources.
Explore Neighborhood Demographics and Statistics
Demographic mapping transforms census data into visual representations that reveal population patterns and community characteristics. You can utilize American Community Survey data, Census Bureau statistics, and local planning documents to create choropleth maps showing age distribution, income levels, educational attainment, and housing patterns. Students learn to interpret statistical data spatially while understanding how demographic trends influence local policy decisions, school district boundaries, and community development priorities across their mapped area.
Construct Literary and Cultural Maps for Language Arts
Literary mapping transforms reading comprehension by visualizing fictional worlds and cultural connections. These educational maps help students analyze character development, understand geographical influences on plot, and explore cultural contexts within literature.
Map Settings from Classic Literature and Novels
Create detailed setting maps that showcase fictional locations alongside real geographical features from classic works. Plot the journey from Hobbiton to Mordor in The Lord of the Rings, or trace the Mississippi River route in The Adventures of Huckleberry Finn. Include elevation data, climate information, and historical context to help students understand how authors use geography to enhance storytelling. Layer topographical details with character movements to reveal how landscape influences narrative structure and character decisions.
Experience Tolkien's epic fantasy with this boxed set. Includes *The Hobbit* and *The Lord of the Rings* in four volumes, all in English.

Trace Character Journeys and Plot Development
Design character journey maps that follow protagonists through their physical and emotional transformations across literary works. Track Odysseus’s ten-year voyage home in The Odyssey, marking each island encounter with plot points and character growth moments. Include timeline annotations, distance calculations, and symbolic locations to demonstrate how physical journeys mirror internal character development. Connect geographical obstacles with narrative conflicts to show how authors use spatial relationships to advance storylines.
Explore Cultural Traditions Across Different Regions
Develop cultural mapping projects that connect literary themes with global traditions and customs from different geographical regions. Map the cultural practices depicted in works like Things Fall Apart across West African communities, or trace the immigration patterns in The Joy Luck Club between China and America. Include demographic data, historical migration routes, and cultural landmarks to help students understand how geography shapes cultural identity and influences literary expression.
Generate Mathematical Maps for STEM Learning
Mathematical maps transform abstract numerical concepts into visual learning tools that help students understand spatial relationships and quantitative patterns.
Use Coordinate Systems and Grid References
Coordinate system maps teach fundamental mathematical concepts through spatial visualization. You’ll create grid-based activities using Cartesian coordinates where students plot points to reveal shapes geometric patterns or mathematical functions. Tools like Desmos Graphing Calculator allow students to map linear equations quadratic functions and trigonometric curves on coordinate planes. These mapping exercises connect algebra and geometry concepts while developing spatial reasoning skills through hands-on coordinate plotting activities.
The TI-84 Plus CE graphing calculator features a vibrant, full-color backlit display for clear visuals. It's lightweight, durable, and comes with preloaded apps to enhance math and science learning.

Apply Scale and Proportion Concepts
Scale-based mapping projects demonstrate proportional relationships through real-world applications. You’ll design activities where students calculate distances using map scales convert between different measurement units and create scaled drawings of school grounds or neighborhoods. Google Earth’s measurement tools help students practice ratio calculations by measuring actual distances and comparing them to map representations. These exercises strengthen fraction decimal and percentage skills while teaching practical applications of mathematical proportions.
Integrate Data Visualization and Statistical Analysis
Statistical mapping combines data analysis with geographical visualization for comprehensive STEM learning. You’ll use tools like Tableau Public or Google Sheets to create choropleth maps displaying census data weather patterns or scientific measurements. Students collect local data such as temperature readings or population statistics then create visual maps showing data distributions patterns and correlations. These projects develop statistical literacy graph interpretation skills and data analysis techniques essential for advanced STEM coursework.
Develop Collaborative Maps for Group Projects
Collaborative mapping transforms classroom dynamics by enabling multiple students to contribute simultaneously to comprehensive educational projects. This approach mirrors professional cartographic workflows while building essential teamwork skills.
Enable Student Contributions and Real-Time Editing
Set up shared digital mapping platforms like ArcGIS Online or Google My Maps that allow simultaneous editing by multiple users. Students can add data points, annotations, and multimedia content while viewing changes from teammates instantly. Configure user permissions to prevent accidental deletions while maintaining collaborative access. Real-time editing capabilities let you monitor student progress and provide immediate guidance throughout the mapping process.
Assign Different Regions or Topics to Teams
Divide complex mapping projects by geographic regions or thematic elements to maximize group efficiency and expertise development. Assign teams specific continents for world history projects or individual states for demographic studies. Each group becomes the expert on their assigned area while contributing to the larger collaborative map. This specialization approach ensures comprehensive coverage while allowing students to develop deep knowledge in their designated focus area.
Create Peer Review and Feedback Systems
Establish structured review protocols where teams evaluate each other’s mapping contributions using standardized rubrics focusing on accuracy, design clarity, and data integration. Schedule rotation periods where groups examine neighboring regions or related topics to identify inconsistencies or suggest improvements. Implement digital annotation tools that allow reviewers to leave specific feedback directly on map elements. This peer assessment process enhances map quality while developing critical evaluation skills essential for geographic analysis.
Conclusion
These seven mapping strategies offer you powerful tools to transform traditional teaching methods and create engaging educational experiences across all subjects. From interactive digital maps that bring geography to life to collaborative projects that foster teamwork you’ll find countless opportunities to enhance student learning through visual storytelling.
The key to successful educational mapping lies in matching the right technique to your specific learning objectives. Whether you’re teaching historical events through timeline maps or exploring mathematical concepts through coordinate systems each approach offers unique benefits that traditional textbooks simply can’t provide.
Start implementing these mapping ideas in your classroom today and watch as your students develop stronger spatial thinking skills while gaining deeper understanding of complex concepts. Your investment in visual learning tools will pay dividends in student engagement and academic achievement.
Frequently Asked Questions
What makes maps better educational tools than traditional textbooks?
Maps transform abstract concepts into visual experiences, helping students understand relationships between places, events, and ideas more effectively. They provide dynamic, interactive learning that engages multiple senses and makes complex information more accessible and memorable across various subjects.
How can interactive digital maps enhance geography lessons?
Interactive digital maps allow students to engage with spatial data dynamically using tools like Google Earth. They provide three-dimensional imagery, virtual field trips, real-time data integration, and multimedia elements that create immersive learning experiences beyond static classroom materials.
What are historical timeline maps and how do they help students?
Historical timeline maps transform abstract historical concepts into visual narratives by showing the rise and fall of civilizations, trade routes, changing political boundaries, and migration patterns. They help students understand how historical events unfolded across time and space.
How do thematic maps improve science education?
Thematic maps transform scientific concepts into visual learning experiences by displaying climate patterns, biodiversity distribution, geological features, and natural resources. They use real data from sources like NOAA and USGS to help students understand complex scientific processes and relationships.
What are community mapping projects in civic education?
Community mapping projects connect students to their local environment by mapping government buildings, services, community resources, and demographic data. These projects transform abstract civic concepts into tangible learning experiences that help students understand their community’s structure and needs.
How can literary and cultural mapping enhance language arts?
Literary and cultural mapping visualizes fictional worlds, character journeys, and cultural connections from literature. Students create setting maps, track character transformations, and explore how geography shapes cultural identity, improving reading comprehension and cultural understanding.
What role do mathematical maps play in STEM learning?
Mathematical maps transform abstract numerical concepts into visual tools that teach coordinate systems, scale and proportion, and statistical analysis. They help students understand spatial relationships, calculate distances, and create data visualizations that combine mathematics with geographical analysis.
How do collaborative mapping projects benefit students?
Collaborative mapping projects allow multiple students to contribute simultaneously using shared digital platforms. They promote teamwork, peer review, and critical evaluation skills while enabling efficient division of complex projects by geographic regions or themes.