6 Best Artistic Mapping Techniques for Data Visualization
The big picture: You’re living through a digital renaissance where geographic information systems (GIS) are breaking free from their traditional technical boundaries and merging with creative expression to produce stunning artistic maps.
Why it matters: This fusion transforms cold data into compelling visual narratives that make complex geographic information accessible and emotionally resonant for diverse audiences.
What’s happening: Artists and cartographers are discovering innovative ways to blend scientific precision with creative vision creating maps that don’t just inform but inspire and engage viewers on multiple levels.
Disclosure: As an Amazon Associate, this site earns from qualifying purchases. Thank you!
P.S. check out Udemy’s GIS, Mapping & Remote Sensing courses on sale here…
Create Interactive Story Maps That Blend Data Visualization With Narrative Art
Understand the structure of a one-hour TV drama pilot. This book provides a guide to story mapping for television.

Interactive story maps transform traditional cartography into compelling digital narratives that guide viewers through geographic data while maintaining artistic appeal. You’ll create maps that function as both analytical tools and storytelling platforms.
Combine Statistical Data With Visual Storytelling Elements
Transform census data and demographic statistics into compelling visual narratives by layering quantitative information with artistic design elements. You can integrate population density figures with hand-drawn neighborhood illustrations or overlay economic data onto watercolor-style base maps. Tools like ArcGIS StoryMaps and Mapbox Studio allow you to embed charts directly within map pop-ups while maintaining custom artistic styling. Combine choropleth mapping techniques with infographic elements to make complex datasets accessible to general audiences while preserving statistical accuracy.
Create vibrant watercolor art with this portable set. It includes 40 colors (metallic & fluorescent), a brush pen, watercolor paper, and more, all in a stylish tin box.

Use Artistic Color Schemes and Typography to Enhance Geographic Information
Select color palettes that support both data classification and aesthetic appeal by choosing schemes that maintain cartographic best practices while reflecting your artistic vision. You’ll want to use ColorBrewer or Adobe Color to develop palettes that ensure proper contrast ratios for accessibility while supporting your narrative theme. Typography choices should complement your data hierarchy – use serif fonts for historical maps or clean sans-serif options for modern datasets. Custom font pairings between headers and labels create visual cohesion while maintaining map readability standards.
Explore history's most significant maps with *Great Maps*. This book delves into cartographic masterpieces and their historical context.

Integrate Multimedia Content Like Audio and Video for Immersive Experiences
Embed audio recordings and video content directly into your interactive maps to create multi-sensory geographic experiences that engage viewers beyond visual elements. You can incorporate field recordings from specific locations or historical audio clips that correspond to mapped events. Use multimedia pop-ups strategically – place video interviews with community members at relevant geographic points or add ambient sound recordings to environmental monitoring data. Platforms like ArcGIS Online and CARTO support multimedia integration while maintaining fast loading speeds across devices.
Design Community-Based Participatory Mapping Projects Using Artistic Expression
Community-based participatory mapping transforms geographic data collection into collaborative art creation. You’ll engage local stakeholders while producing aesthetically compelling spatial narratives that reflect authentic community perspectives.
Encourage Local Artists to Contribute Visual Elements to Geographic Data
Partner with neighborhood artists to create custom symbology and visual markers for your GIS projects. You can commission hand-drawn icons representing local landmarks, cultural sites, and community assets that replace standard GIS symbols. Artists often contribute unique color palettes reflecting regional identity, transforming sterile datasets into culturally resonant maps. Collaborate directly with muralists, graphic designers, and traditional craftspeople to ensure visual elements authentically represent community character while maintaining cartographic clarity and data accuracy.
Create vibrant art on various surfaces with this 36-color acrylic marker set. The soft brush tips allow for precise lines and blending, while the visual ink window prevents unexpected interruptions.

Implement Collaborative Digital Platforms for Artistic Map Creation
Deploy cloud-based mapping platforms like ArcGIS Online or QGIS Cloud to enable real-time collaborative editing between community members and artists. You’ll establish shared workspaces where participants contribute both geographic data and artistic interpretations simultaneously. Set up structured workflows using Survey123 or KoBo Toolbox for community data collection, then integrate artistic overlays through platforms like Mapbox Studio. These digital environments allow multiple contributors to add sketches, annotations, and creative visualizations while preserving spatial accuracy and version control.
Showcase Cultural Heritage Through Aesthetically Enhanced Spatial Analysis
Transform cultural heritage data into visually compelling spatial narratives using artistic enhancement techniques. You’ll layer historical photographs, traditional patterns, and cultural symbols over archaeological site data or heritage building locations. Apply artistic filters and hand-drawn styling to satellite imagery to create unique base maps that reflect cultural aesthetics. Integrate oral histories as interactive audio elements linked to specific geographic coordinates, combining traditional storytelling with modern GIS visualization to preserve and present cultural knowledge through spatially-aware artistic expression.
Develop 3D Terrain Models With Sculptural and Installation Art Elements
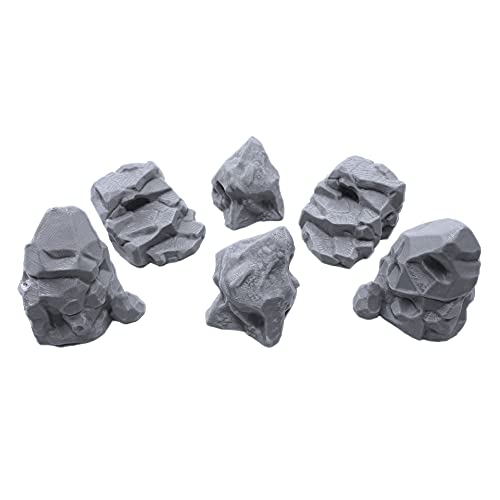
Enhance your tabletop games with this set of six highly detailed, 3D printed stone boulder terrain pieces. Perfect for 28mm miniatures, these paintable PLA plastic models add immersive scenery to any battlefield.
You’ll discover how transforming elevation data into tangible art pieces creates powerful connections between geographic information and audience experience. This integration of sculptural elements with GIS terrain analysis opens new possibilities for spatial storytelling that engages viewers through multiple senses.
Transform Digital Elevation Models Into Physical Art Installations
Convert your DEM data into sculptural pieces using 3D printing technology and CNC milling techniques. Extract elevation profiles from high-resolution LiDAR datasets and translate them into scaled physical models that visitors can touch and explore. Artists like Maya Lin have demonstrated how topographic data becomes compelling when rendered as large-scale installations. You’ll need to consider material choices—foam, wood, or metal—that complement your data’s scale and intended message while maintaining geographic accuracy.
Create 3D art with the SCRIB3D P1 3D Pen! This easy-to-use pen features adjustable speed control and includes PLA filament, a stencil book, and project guide to get you started.

Create Gallery Exhibitions Featuring Topographic Art Pieces
Design gallery spaces that showcase terrain data as aesthetic objects by mounting 3D-printed topographic models alongside traditional 2D maps and digital displays. Incorporate interactive elements where visitors manipulate physical terrain pieces to trigger corresponding digital visualizations. Museums like the Exploratorium have successfully integrated tactile geographic models with augmented reality components. Position your installations to create visual flow that guides viewers through different scales of geographic information.
Use Mixed Media to Represent Geological and Environmental Data
Combine traditional sculptural materials with data-driven elements to represent complex environmental patterns across landscapes. Layer transparent materials to show geological stratification while incorporating LED lighting systems that respond to temperature or precipitation data. Artists working with climate scientists have created installations where copper oxidation patterns mirror actual soil pH variations. Integrate sound components that translate seismic data into audio experiences complementing your visual terrain representations.
Craft Data-Driven Street Art and Murals Based on Geographic Information
Transform public spaces into interactive geographic narratives by converting spatial data into large-scale artistic installations. You’ll create meaningful connections between communities and their geographic context through visually compelling street art that communicates complex spatial information.
Translate Census Data Into Large-Scale Public Art Projects
Create murals that visualize demographic patterns by converting census block data into color-coded artistic elements. You can represent population density through texture variations or income levels through gradient transitions across building facades. Transform statistical tables into geometric patterns that reveal neighborhood characteristics—use ArcGIS Pro to extract specific census variables and convert them into design templates for wall-scale installations.
Design Neighborhood Maps as Community Murals
Develop collaborative mapping projects where residents contribute local knowledge to large-scale wall maps. You’ll combine OpenStreetMap data with community input to create murals showing walking paths, cultural landmarks, and informal gathering spaces. Use QGIS to generate base maps at appropriate scales, then work with local artists to incorporate hand-drawn elements that represent community-identified features missing from traditional cartographic databases.
Incorporate QR Codes Linking Physical Art to Digital GIS Platforms
Embed interactive elements within murals by placing QR codes that connect viewers to web-based mapping applications. You can link specific mural sections to ArcGIS Online dashboards showing real-time data updates or historical map overlays. Position codes strategically within artistic compositions—integrate them as design elements rather than obvious additions, allowing viewers to access deeper geographic analysis while experiencing the physical artwork.
Build Virtual Reality Experiences That Merge Geographic Data With Artistic Environments
Virtual reality transforms static geographic data into immersive worlds where scientific accuracy meets creative expression. You’ll discover how VR platforms enable unprecedented integration of real-world spatial information with artistic environments that captivate and educate audiences.
Create Immersive Landscapes Using Real Geographic Information
Create VR landscapes by importing digital elevation models from USGS databases into Unity or Unreal Engine platforms. Transform raw LIDAR data into stylized terrains using custom shaders that highlight elevation changes through artistic color gradients and textures. You’ll generate photo-realistic environments by draping high-resolution satellite imagery over 3D terrain models while incorporating abstract artistic elements like floating geometric shapes or particle effects that respond to elevation data. Populate these virtual spaces with artistic interpretations of vegetation patterns derived from NDVI satellite measurements.
Design Artistic Interpretations of Historical Geographic Changes
Design time-based VR experiences showing landscape evolution through artistic temporal visualizations in platforms like A-Frame or WebXR. Layer historical maps from different decades as semi-transparent overlays that users navigate through gesture controls or timeline interfaces. You’ll create abstract representations of urban growth patterns using flowing particle systems that trace development over time while incorporating artistic elements like morphing sculptural forms representing demographic changes. Combine archival photographs with artistic rendering techniques to show coastline changes or deforestation patterns through visually compelling artistic transitions.
Develop Educational VR Tours With Artistic Geographic Visualizations
Develop educational VR tours combining accurate GPS coordinates with artistic data representation using platforms like Mozilla Hubs or custom WebGL applications. Structure guided experiences where users explore watersheds visualized as flowing artistic ribbons or migration patterns represented through luminous particle trails. You’ll integrate real-time environmental data feeds with artistic visualizations showing air quality as color-shifting atmospheric effects or temperature variations through dynamic artistic textures. Create interactive waypoints where users manipulate artistic geographic elements to understand spatial relationships between environmental factors and human activities.
Produce Print-Based Artistic Maps for Gallery and Commercial Display
You’ll transform traditional cartographic data into museum-quality artwork that bridges technical precision with visual impact. High-resolution print production requires careful attention to color profiles and vector scaling to maintain artistic integrity across different display formats.
Design Limited Edition Art Prints Using Geographic Data
You can create exclusive cartographic artwork by combining elevation data with artistic color palettes that emphasize topographic beauty. Export your GIS layers at 300 DPI resolution using CMYK color profiles for professional printing standards. Consider incorporating hand-lettered typography or watercolor overlays to distinguish your prints from standard reference maps. Limited edition numbering and artist signatures increase commercial value for gallery sales. Popular formats include 18×24 inch and 24×36 inch sizes that accommodate detailed geographic features while remaining suitable for residential and commercial wall display.
Create Abstract Artistic Interpretations of Traditional Maps
You’ll deconstruct conventional mapping elements into expressive visual compositions that maintain geographic accuracy while emphasizing aesthetic appeal. Remove traditional legends and north arrows to create cleaner artistic presentations. Experiment with monochromatic color schemes or gradient fills that highlight elevation changes or population density through artistic interpretation. Consider isolating specific geographic features like coastlines or river systems as focal points for minimalist designs. These abstract approaches work particularly well for urban planning visualization or environmental data representation in contemporary art settings.
Develop Custom Artistic Cartography for Interior Design Applications
You can create bespoke mapping artwork that complements specific architectural environments and color schemes. Collaborate with interior designers to match geographic artwork with existing decor themes and spatial requirements. Custom cartography for restaurants might emphasize local watershed boundaries or agricultural regions relevant to menu sourcing. Corporate installations often feature stylized maps of service territories or historical company locations. Scale your designs to fit specific wall dimensions and consider multi-panel installations that create dramatic visual impact across large commercial spaces.
Conclusion
The fusion of GIS technology with artistic expression opens endless possibilities for your creative projects. Whether you’re developing immersive VR experiences or crafting elegant print maps these approaches transform how audiences connect with geographic information.
You’ll find that each technique offers unique advantages for different contexts and audiences. Interactive story maps excel at digital engagement while artistic print maps create lasting physical impressions. Virtual reality experiences provide unmatched immersion and community-based mapping builds authentic local connections.
Your success depends on balancing technical accuracy with creative vision. Start with one approach that aligns with your current skills and gradually expand your toolkit. The digital mapping landscape continues evolving and your artistic contributions will help shape its future direction.
Frequently Asked Questions
What is the digital renaissance in GIS mapping?
The digital renaissance in GIS mapping refers to the evolution of geographic information systems that merge with artistic expression. This movement transforms raw geographic data into visually compelling narratives, making complex spatial information more accessible and emotionally impactful through creative collaboration between artists and cartographers.
How do interactive story maps enhance data visualization?
Interactive story maps blend data visualization with narrative art by combining statistical data with visual storytelling elements. They use tools like ArcGIS StoryMaps and Mapbox Studio to create immersive experiences that integrate multimedia content, artistic color schemes, and typography while maintaining geographic accuracy and accessibility.
What is community-based participatory mapping?
Community-based participatory mapping involves collaborative spatial narratives that reflect authentic community perspectives. This approach encourages partnerships with local artists to develop culturally resonant visual elements and uses cloud-based mapping platforms for real-time collaboration, ensuring that geographic data represents genuine community voices and experiences.
How can cultural heritage be represented through spatial analysis?
Cultural heritage can be represented by layering historical and cultural elements over geographic data through aesthetically enhanced spatial analysis. This approach preserves cultural knowledge through artistic expression, creating maps that showcase the relationship between geography and cultural significance while maintaining both accuracy and visual appeal.
What role does VR play in artistic geographic visualization?
Virtual reality transforms static geographic data into immersive worlds by merging spatial information with artistic environments. Using digital elevation models and LIDAR data, VR experiences can visualize historical geographic changes, create educational tours, and develop time-based experiences that combine accurate GPS coordinates with artistic environmental representations.
How are print-based artistic maps created for commercial use?
Print-based artistic maps for commercial use require high-resolution production while maintaining artistic integrity. They incorporate unique design elements like hand-lettered typography and watercolor overlays, creating limited edition art prints from geographic data. These maps balance aesthetic appeal with geographic accuracy for gallery displays and interior design applications.
What tools are recommended for creating artistic maps?
Key tools for creating artistic maps include ArcGIS StoryMaps and Mapbox Studio for interactive experiences, cloud-based mapping platforms for collaborative projects, and VR development software for immersive experiences. These tools help maintain accuracy while enabling creative expression through color schemes, typography, and multimedia integration.
How do artistic maps maintain geographic accuracy?
Artistic maps maintain geographic accuracy by using verified geographic data as the foundation and applying artistic elements as enhancements rather than replacements. Professional cartographers collaborate with artists to ensure that creative interpretations don’t compromise spatial precision, preserving the integrity of location-based information while improving visual engagement.