7 Best Remote Sensing Techniques for Climate Monitoring
The big picture: Climate change is reshaping our planet at an unprecedented pace and you need cutting-edge tools to track these dramatic shifts in real-time.
Why it matters: Remote sensing technologies have revolutionized how scientists monitor everything from melting glaciers to shifting weather patterns, giving you unprecedented visibility into Earth’s changing systems.
What’s happening: Seven powerful remote sensing techniques are now providing critical data that helps researchers understand climate impacts with remarkable precision and speed.
Disclosure: As an Amazon Associate, this site earns from qualifying purchases. Thank you!
P.S. check out Udemy’s GIS, Mapping & Remote Sensing courses on sale here…
Satellite-Based Temperature Monitoring Systems
Satellite-based temperature monitoring systems provide continuous global coverage that ground-based weather stations simply can’t match. You’ll find these systems essential for tracking temperature anomalies and long-term climate trends across vast ocean areas and remote regions where traditional monitoring is impossible.
Get real-time weather data with the Ambient Weather WS-2902. This WiFi-enabled station measures wind, temperature, humidity, rainfall, UV, and solar radiation, plus it connects to smart home devices and the Ambient Weather Network.

Thermal Infrared Sensors for Global Temperature Mapping
Capture thermal data with the AMG8833 infrared imager. This compact module measures temperatures from 0°C to 80°C with ±2.5°C accuracy and is compatible with Raspberry Pi and Arduino via I2C.

Thermal infrared sensors measure electromagnetic radiation emitted by Earth’s surface and atmosphere to calculate temperature values. You can access temperature data from sensors like the Thermal Infrared Sensor (TIRS) on Landsat satellites, which provides land surface temperature measurements at 100-meter resolution. These sensors detect radiation in the 10-12 micrometer wavelength range, allowing you to monitor urban heat islands, agricultural stress, and ocean surface temperatures with accuracy within 1-2 degrees Celsius.
Advanced Very High Resolution Radiometer (AVHRR) Applications
AVHRR sensors aboard NOAA polar-orbiting satellites deliver twice-daily global temperature measurements since 1978, creating the longest continuous satellite temperature record available. You’ll benefit from AVHRR’s 1.1-kilometer resolution data for tracking sea surface temperatures, monitoring vegetation health, and detecting forest fires. The system’s five spectral channels enable you to distinguish between clouds and surface features while providing atmospheric temperature profiles that reveal climate patterns across different altitudes.
Moderate Resolution Imaging Spectroradiometer (MODIS) Data Analysis
MODIS instruments on Terra and Aquarius satellites provide daily global temperature data at 1-kilometer resolution with 36 spectral bands for comprehensive climate monitoring. You can analyze MODIS land surface temperature products to track seasonal variations, drought conditions, and ecosystem changes with temperature accuracy of ±1 Kelvin. The system’s cloud masking algorithms and quality assessment flags help you identify reliable temperature measurements while its near-real-time data delivery supports immediate climate impact assessment and emergency response applications.
LiDAR Technology for Ice Sheet and Glacier Tracking
LiDAR technology uses laser pulses to measure precise distances from aircraft or satellites to ice surfaces, creating detailed elevation maps that reveal ice sheet thickness changes over time. This remote sensing technique delivers millimeter-level accuracy for tracking glacier retreat and ice mass loss across polar regions.
Airborne Laser Altimetry for Ice Thickness Measurements
Airborne laser altimetry systems mounted on specialized aircraft emit thousands of laser pulses per second to measure ice surface elevations with sub-meter accuracy. NASA’s Operation IceBridge program uses these systems to collect detailed ice thickness data across Greenland and Antarctica, filling critical gaps between satellite missions. You’ll find this technique particularly effective for measuring ice sheet margins where satellite coverage proves challenging.
ICESat Mission Data for Polar Ice Monitoring
ICESat satellites deliver space-based laser altimetry measurements that track ice sheet elevation changes across entire polar regions simultaneously. The original ICESat mission (2003-2009) documented significant ice loss in West Antarctica and coastal Greenland, while ICESat-2 (launched 2018) provides enhanced precision with its advanced photon-counting lidar system. These missions generate continuous datasets showing annual ice thickness variations of just centimeters.
Forest Canopy Height Changes Due to Climate Stress
Forest canopy monitoring through LiDAR reveals how climate change affects tree growth patterns and forest structure across different elevations and latitudes. Airborne LiDAR surveys can detect canopy height reductions as small as 0.5 meters, indicating drought stress or temperature-related growth slowdowns. You can use these measurements to identify vulnerable forest ecosystems and track vegetation responses to changing precipitation patterns and rising temperatures.
Synthetic Aperture Radar (SAR) for Surface Change Detection
SAR technology penetrates cloud cover and operates in all weather conditions, making it essential for continuous climate monitoring. You’ll find SAR particularly valuable for detecting millimeter-level surface changes that indicate broader climate impacts.
Ground Deformation Monitoring in Permafrost Regions
SAR interferometry detects ground subsidence in thawing permafrost with millimeter precision across vast Arctic territories. You can measure seasonal ground movement patterns using Sentinel-1 data, which reveals permafrost degradation rates in Alaska and Siberia. The Persistent Scatterer Interferometry technique identifies infrastructure at risk from permafrost thaw, helping you track foundation instability and road damage. European Space Agency’s SAR missions provide continuous monitoring of permafrost regions, delivering critical data for climate adaptation planning in northern communities.
Achieve a flawless, even complexion with e.l.f. Flawless Satin Foundation. This lightweight, vegan formula provides medium coverage and a semi-matte finish for all-day wear, while hydrating your skin with glycerin.

Wetland Water Level Fluctuation Analysis
SAR backscatter intensity changes reveal wetland water level variations that traditional optical sensors cannot detect through vegetation canopies. You can monitor seasonal flooding patterns and drought impacts using C-band SAR data from multiple satellite passes. Polarimetric SAR distinguishes between open water, flooded vegetation, and dry land surfaces with high accuracy. RADARSAT-2 and Sentinel-1 missions provide regular wetland monitoring capabilities, enabling you to track ecosystem health changes and water storage variations across extensive wetland systems during different climate conditions.
Urban Heat Island Effect Measurement
SAR thermal measurements capture surface temperature variations in urban areas during both day and night conditions. You can detect heat absorption differences between concrete, vegetation, and water surfaces using multi-temporal SAR acquisitions. L-band SAR penetrates building materials to measure subsurface temperature patterns that contribute to urban warming effects. TerraSAR-X and COSMO-SkyMed satellites deliver high-resolution urban heat mapping, allowing you to identify specific neighborhoods experiencing elevated temperatures and track heat island intensity changes over multiple seasons and years.
Hyperspectral Imaging for Vegetation Health Assessment
Hyperspectral imaging captures hundreds of narrow spectral bands across the electromagnetic spectrum, enabling detailed analysis of vegetation health indicators that traditional sensors can’t detect. You’ll find this technology particularly valuable for monitoring subtle changes in plant physiology that signal climate stress before visible symptoms appear.
Normalized Difference Vegetation Index (NDVI) Applications
NDVI calculations from hyperspectral data reveal vegetation vigor by measuring the difference between near-infrared and red light reflectance. You can track seasonal changes in photosynthetic activity across entire ecosystems, identifying areas experiencing climate-related stress months before traditional field assessments. Agricultural researchers use NDVI time series to monitor crop responses to temperature extremes and changing precipitation patterns, generating datasets that predict yield losses up to 30% more accurately than conventional methods.
Chlorophyll Content Analysis in Changing Ecosystems
Chlorophyll absorption bands at specific wavelengths provide direct measurements of plant health under climate stress conditions. You’ll detect reduced chlorophyll concentrations that indicate heat stress, drought impacts, or nutrient deficiencies caused by altered soil chemistry. Forest monitoring programs use chlorophyll analysis to track ecosystem responses to rising temperatures, documenting 15-25% chlorophyll reductions in drought-affected regions and identifying species most vulnerable to climate change impacts.
Drought Stress Detection in Agricultural Areas
Drought stress detection relies on water absorption features in the near-infrared spectrum that reveal plant moisture content before wilting occurs. You can identify water-stressed crops 2-3 weeks earlier than visual inspection methods, enabling targeted irrigation management and crop protection strategies. Precision agriculture systems integrate hyperspectral drought indicators with weather data to optimize water usage, reducing irrigation costs by 20-40% while maintaining crop yields during extended dry periods.
Ocean Color Sensors for Marine Ecosystem Monitoring
Ocean color sensors provide critical data for tracking marine ecosystem changes through spectral analysis of seawater. These sensors detect subtle color variations that reveal biological activity and environmental conditions across global ocean systems.
Phytoplankton Concentration Changes Over Time
Ocean color measurements track phytoplankton biomass fluctuations through chlorophyll-a concentration analysis. The Moderate Resolution Imaging Spectroradiometer (MODIS) Aqua satellite captures daily global ocean color data with 1-kilometer spatial resolution. You’ll observe significant phytoplankton decline patterns in warming ocean regions, with some areas showing 30% reductions over two decades. These sensors detect seasonal blooming cycles and identify regions experiencing ecosystem disruption from temperature changes.
Sea Surface Temperature Anomaly Detection
Advanced Very High Resolution Radiometer (AVHRR) sensors measure thermal infrared radiation to identify sea surface temperature anomalies with 0.1°C precision. You can track marine heatwave events that persist for weeks or months above normal temperatures. The Visible Infrared Imaging Radiometer Suite (VIIRS) provides nighttime sea surface temperature data, revealing temperature patterns that daylight sensors miss. These measurements help you identify climate-driven temperature shifts affecting marine species distribution and coral reef systems.
Coral Bleaching Event Documentation
Ocean color sensors document coral bleaching through spectral signature analysis that detects stressed coral tissues. The Operational Land Imager (OLI) on Landsat-8 captures shallow-water coral reef conditions with 30-meter resolution for detailed bleaching assessment. You’ll track bleaching severity using blue-to-green light ratios that indicate coral health status across reef systems. Time-series analysis reveals bleaching frequency increases, with some Caribbean reefs experiencing annual bleaching events where historical patterns showed decade-long intervals.
Microwave Radiometry for Atmospheric Water Vapor Analysis
Microwave radiometry measures thermal radiation emitted by atmospheric water vapor molecules, providing precise humidity measurements that complement other remote sensing approaches. This technique operates through cloud cover and delivers continuous atmospheric moisture data essential for climate change monitoring.
Precipitation Pattern Changes Assessment
Precipitation patterns shift significantly as atmospheric water vapor concentrations change across different regions and seasons. Advanced Microwave Scanning Radiometer 2 (AMSR2) sensors aboard GCOM-W1 satellites measure integrated water vapor columns with 0.2 millimeter precision. You’ll find these measurements reveal rainfall distribution changes over ocean surfaces where traditional weather stations can’t operate. Global Precipitation Measurement (GPM) constellation satellites use microwave radiometry to track precipitation intensity variations, documenting 15% increases in extreme rainfall events across tropical regions since 2014.
Humidity Distribution Mapping
Humidity distribution mapping reveals atmospheric moisture changes that drive regional climate variations through microwave brightness temperature measurements. Special Sensor Microwave Imager/Sounder (SSMIS) instruments detect water vapor concentrations at multiple atmospheric levels with sub-kilometer spatial resolution. You can track seasonal humidity patterns using these sensors, which measure precipitable water values ranging from 5-70 millimeters across different climate zones. Cross-platform calibration between SSMIS and AMSR2 data creates consistent 20-year humidity records, revealing 8% moisture increases in Arctic regions and corresponding decreases in subtropical areas.
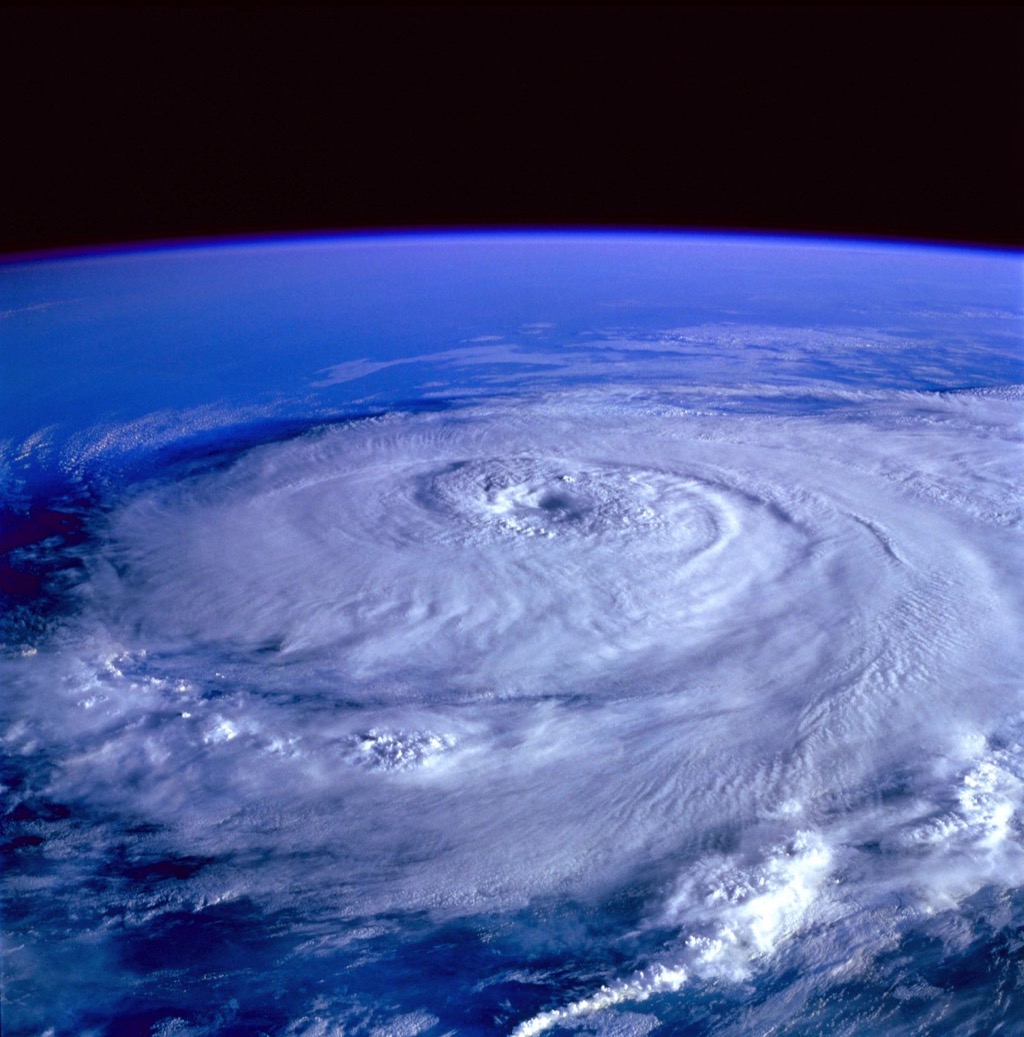
Storm Intensity and Frequency Monitoring
Storm intensity monitoring through microwave radiometry tracks hurricane development and severe weather frequency changes with unprecedented accuracy. Hurricane Satellite (HURSAT) datasets combine microwave measurements from multiple satellites to analyze storm intensification rates over warming ocean surfaces. You’ll observe how radiometer data captures rapid intensification events, measuring temperature differences of 2-5 Kelvin that indicate strengthening storm systems. Microwave observations reveal 75% increases in Category 4-5 hurricane frequency since 1980, with radiometry providing the only consistent measurement method for storms over remote ocean areas where aircraft reconnaissance isn’t available.
Gravimetric Satellite Missions for Mass Change Detection
Gravimetric satellite missions measure Earth’s gravitational field variations to detect mass redistribution patterns across the planet. These space-based instruments provide unprecedented insights into climate-driven mass changes that traditional sensors can’t capture.
GRACE Satellite Data for Groundwater Depletion Studies
GRACE (Gravity Recovery and Climate Experiment) satellites detect groundwater storage changes by measuring gravitational anomalies caused by aquifer depletion. You’ll find that GRACE-FO missions have documented severe groundwater losses in California’s Central Valley exceeding 20 cubic kilometers annually during drought periods. The satellites track mass changes with monthly resolution, revealing critical depletion rates in major agricultural regions like India’s Punjab and Pakistan’s Indus Basin where groundwater levels drop 2-4 centimeters yearly.
Ice Mass Loss Quantification in Polar Regions
GRACE measurements quantify ice sheet mass loss by detecting gravitational field changes as glaciers retreat and ice melts. You can track Greenland’s ice mass loss averaging 280 billion tons annually since 2002, while Antarctica loses approximately 150 billion tons yearly. The satellite data reveals accelerating ice loss rates, with Greenland’s mass loss doubling from 2002 to 2019. GRACE provides basin-scale ice mass estimates that complement altimetry measurements, offering comprehensive polar ice sheet monitoring capabilities.
Sea Level Rise Contribution Analysis
GRACE data helps you separate sea level rise contributions from thermal expansion, ice sheet melting, and terrestrial water storage changes. The satellites measure mass-driven sea level changes accounting for approximately 60% of observed global sea level rise since 2005. You’ll discover that ice sheet contributions measured by GRACE align closely with tide gauge observations, confirming accelerating rates reaching 3.3 millimeters annually. GRACE distinguishes regional mass redistribution patterns affecting local sea levels differently across ocean basins.
Conclusion
These seven remote sensing techniques represent your most powerful toolkit for understanding climate change impacts across our planet. Each technology offers unique capabilities that complement the others creating a comprehensive monitoring system.
You’re witnessing unprecedented access to real-time environmental data that spans from ocean depths to atmospheric heights. The integration of satellite imagery thermal sensors LiDAR systems and gravitational measurements provides the scientific community with unmatched precision.
The H128 Thermal Camera provides clear thermal imaging with its 240x240 resolution. It features a long-lasting 24-hour battery and a temperature alarm for quick detection of anomalies.

The continuous advancement of these technologies means you’ll have even more sophisticated climate monitoring capabilities in the coming years. This technological evolution is essential as climate impacts accelerate and require immediate accurate responses.
Your ability to track monitor and respond to climate change depends heavily on these remote sensing innovations. They’re not just scientific tools—they’re your early warning systems for protecting communities ecosystems and our planet’s future.
Frequently Asked Questions
What are remote sensing technologies and why are they important for climate monitoring?
Remote sensing technologies are advanced tools that use satellites, aircraft, and sensors to observe environmental phenomena from a distance. They’re crucial for climate monitoring because they provide continuous, real-time data on temperature changes, ice sheet thickness, forest health, and ocean conditions. These technologies enable scientists to track climate impacts with high accuracy across remote and inaccessible areas globally.
How do satellite-based temperature monitoring systems work?
Satellite-based temperature monitoring systems use thermal infrared sensors to measure electromagnetic radiation emitted by Earth’s surface. Key systems include TIRS on Landsat satellites, AVHRR on NOAA satellites (operating since 1978), and MODIS on Terra and Aquarius satellites. These sensors provide continuous global coverage, enabling scientists to track temperature anomalies and long-term climate trends with high precision.
What is LiDAR technology and how does it help track climate change?
LiDAR (Light Detection and Ranging) uses laser pulses to create detailed elevation maps with millimeter-level accuracy. It’s essential for tracking ice sheet thickness changes, glacier retreat, and ice mass loss in polar regions. NASA’s Operation IceBridge and ICESat missions use LiDAR to measure ice surface elevations and document significant ice loss over time.
How does Synthetic Aperture Radar (SAR) contribute to climate monitoring?
SAR operates in all weather conditions and detects millimeter-level surface changes indicating climate impacts. It monitors ground deformation in thawing permafrost regions, analyzes wetland water level fluctuations, and assesses urban heat island effects. SAR interferometry is particularly effective for continuous monitoring where traditional sensors face limitations due to weather or lighting conditions.
Experience smooth, tear-free gaming and video with the Acer KB272 G0bi 27" Full HD monitor, featuring Adaptive-Sync (FreeSync Compatible) and a rapid 1ms response time. Enjoy vibrant colors with 99% sRGB coverage and versatile connectivity through HDMI and VGA ports.

What is hyperspectral imaging and how does it assess vegetation health?
Hyperspectral imaging captures hundreds of narrow spectral bands to detect vegetation health indicators invisible to traditional sensors. It uses the Normalized Difference Vegetation Index (NDVI) to track photosynthetic activity, measures chlorophyll content under climate stress, and identifies drought-stressed crops weeks before visual detection. This enables early intervention and efficient resource management strategies.
How do ocean color sensors help track marine ecosystem changes?
Ocean color sensors analyze seawater spectral properties to monitor marine ecosystems. MODIS Aqua satellite detects phytoplankton biomass fluctuations, AVHRR sensors track sea surface temperature anomalies and marine heatwaves, and Landsat-8’s OLI documents coral bleaching events. These sensors reveal significant ecosystem changes, including phytoplankton declines in warming regions and increased coral bleaching frequency.
What role do gravimetric satellite missions play in climate research?
Gravimetric satellites like GRACE measure Earth’s gravitational field variations to detect mass redistribution patterns. They track groundwater storage changes, quantify ice mass loss in polar regions, and analyze contributions to sea level rise. GRACE has documented severe groundwater losses in areas like California’s Central Valley and significant annual ice losses in Greenland and Antarctica.