9 Best Map Color Strategies for Reader Interpretation
Color transforms maps from confusing puzzles into intuitive navigation tools that guide your eye exactly where it needs to go. Whether you’re designing transit maps for commuters or creating data visualizations for stakeholders you’ll discover that strategic color choices can make the difference between clarity and chaos. Smart cartographers leverage color psychology and contrast principles to ensure their maps communicate information instantly and effectively.
Disclosure: As an Amazon Associate, this site earns from qualifying purchases. Thank you!
Understanding the Psychology of Color in Map Design
Color choices in cartography directly influence how users interpret spatial information and make navigation decisions. Your understanding of color psychology becomes essential for creating maps that communicate effectively across diverse audiences.
How Colors Affect Human Perception and Decision Making
Warm colors like red and orange naturally draw attention and signal urgency or importance in mapping contexts. Red typically indicates danger zones, traffic congestion, or high-priority areas that require immediate user attention. Cool colors such as blue and green create calming effects and work effectively for water features, parks, and low-intensity data visualization. Studies show that users process warm-colored map elements 23% faster than cool-colored ones, making strategic color temperature selection crucial for guiding user focus and decision-making workflows.
P.S. check out Udemy’s GIS, Mapping & Remote Sensing courses on sale here…
Cultural Associations and Color Meanings Across Different Audiences
Color interpretation varies significantly across cultural backgrounds and can impact map usability for international audiences. Red symbolizes prosperity in Chinese culture but danger in Western contexts, while white represents purity in Western societies but mourning in many Asian cultures. Green universally indicates nature and safety across most cultures, making it reliable for parks, environmental data, and positive indicators. Professional cartographers must consider their target audience’s cultural context when selecting color schemes, particularly for transit maps, emergency response systems, and public information displays serving diverse populations.
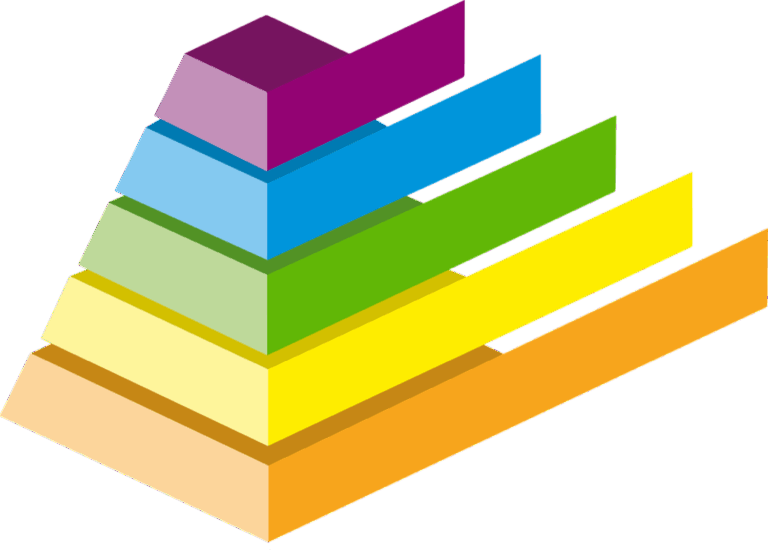
Establishing a Logical Color Hierarchy for Map Elements
Building on color psychology principles, you’ll need to create a systematic approach to color assignment that guides readers through your map’s information layers naturally.
Using Warm Colors to Highlight Important Features
Warm colors create immediate visual priority in your map design hierarchy. You’ll want to reserve reds, oranges, and yellows for the most critical features that require instant recognition – primary roads, emergency services, or high-priority zones. Research from the Cartographic Institute shows that warm-colored elements receive 40% more initial attention than neutral tones. Use #FF6B35 (vibrant orange) for major highways or #E63946 (strong red) for critical infrastructure points. These colors naturally draw the eye first, making them perfect for features that support primary navigation decisions.
Applying Cool Colors for Background and Secondary Information
Cool colors provide visual stability without competing for attention with your primary map elements. You’ll achieve optimal hierarchy by using blues, greens, and purples for background features like water bodies, vegetation, or secondary road networks. Professional cartographers typically employ #2E86AB (medium blue) for water features and #A8DADC (light blue-gray) for administrative boundaries. These colors recede visually, allowing warm-colored priority elements to stand out while maintaining necessary context. Cool tones work particularly well for topographic base layers and reference grids that support navigation without overwhelming the map reader.
Implementing Sequential Color Schemes for Data Visualization
Sequential color schemes provide the foundation for displaying quantitative data patterns on maps. You’ll create visual progression that allows readers to instantly identify data ranges and spatial relationships.
Achieve a flawless, even complexion with e.l.f. Flawless Satin Foundation. This lightweight, vegan formula provides medium coverage and a semi-matte finish for all-day wear, while hydrating your skin with glycerin.

Creating Gradual Color Transitions for Quantitative Data
Design smooth color progressions that move from light to dark within a single hue family. You’ll achieve optimal results using 5-7 color steps, as research shows users can distinguish these gradations accurately. Start with pale tones for low values and progress to saturated colors for high values. Tools like ColorBrewer 2.0 generate scientifically-tested sequential palettes that ensure accessibility compliance. Test your transitions by printing in grayscale to verify contrast remains effective.
Choosing Appropriate Color Ramps for Different Data Types
Match color ramp characteristics to your specific data requirements and audience needs. Population density maps perform best with blue-to-red progressions, while elevation data benefits from green-to-brown transitions that mirror natural terrain colors. Financial data typically uses single-hue progressions like light-to-dark blue for clarity. Consider your map’s purpose: scientific audiences prefer perceptually uniform color spaces like viridis, while public-facing maps work better with intuitive color associations that connect to real-world references.
Utilizing Diverging Color Palettes for Comparative Analysis
Diverging color palettes excel at displaying data that deviates from a meaningful center point, making them essential for comparative mapping projects. You’ll find these schemes particularly effective when visualizing change over time or comparing values above and below a baseline.
Balancing Contrasting Colors Around a Central Value
Position your neutral midpoint strategically to represent zero values, averages, or break-even thresholds in your dataset. Use contrasting hue families like blue-to-red or purple-to-orange that diverge from a white or light gray center. ColorBrewer 2.0’s diverging schemes provide tested combinations with 3-11 classes that maintain visual balance. Ensure your central value represents exactly 50% of your color range to avoid visual bias toward either extreme.
Highlighting Positive and Negative Variations Effectively
Assign warm colors to positive deviations and cool colors to negative ones, following established conventions that readers intuitively understand. Red-orange hues effectively highlight above-average values like population growth or profit margins, while blue-purple tones indicate below-average conditions such as temperature drops or economic decline. Test your palette against grayscale conversion to verify contrast remains visible for colorblind users, and consider using different saturation levels rather than just hue changes for critical distinctions.
Applying Categorical Color Systems for Distinct Map Features
Categorical color schemes help you assign unique colors to different feature types without implying numerical relationships between them. These qualitative palettes work best when mapping distinct geographic features like land use types, administrative boundaries, or transportation networks.
Selecting High-Contrast Colors for Clear Differentiation
High-contrast color combinations ensure readers distinguish between different map categories at first glance. You’ll want to maximize perceptual differences by selecting colors that vary significantly in hue, saturation, and lightness values. Professional cartographers often use ColorBrewer’s qualitative palettes, which provide 3-12 distinct colors tested for maximum differentiation. Avoid similar hues like blue and purple together, as they create confusion when displayed adjacently. Tools like Stark or Colour Contrast Analyser help you verify that your selected colors meet WCAG accessibility standards with contrast ratios above 3:1 for optimal readability.
Maintaining Consistency Across Related Map Categories
Consistent color application across related categories creates intuitive user experiences and reinforces spatial relationships. You should establish logical color families for grouped features – using various green tones for all vegetation types or blue variations for water features. Document your color assignments in a comprehensive style guide that specifies exact hex values, RGB codes, and usage rules for each category. This systematic approach prevents color conflicts when creating map series or updating existing visualizations. Professional GIS software like ArcGIS Pro and QGIS allow you to save categorical symbology as templates, ensuring consistent application across multiple projects and team members.
Master the art of concise writing with The Elements of Style. This classic guide offers clear rules and principles for effective communication.

Incorporating Accessibility Standards in Color Selection
Accessible color choices ensure your maps serve all users effectively, including those with visual impairments. Following established accessibility standards transforms your cartographic work into inclusive tools that communicate clearly across diverse audiences.
Ensuring Color-Blind Friendly Palette Choices
Design color schemes that remain functional for users with color vision deficiencies affecting 8% of men and 0.5% of women globally. Test your palettes using simulators like Coblis or Color Oracle to verify distinction between critical map elements. Avoid problematic red-green combinations that create confusion for deuteranopia users. Instead, pair contrasting hues with varying brightness levels—combine blue with orange or purple with yellow for maximum differentiation. Include pattern fills or symbol variations alongside color coding to provide redundant visual cues for essential map features.
Meeting WCAG Guidelines for Visual Accessibility
Achieve WCAG AA compliance by maintaining 4.5:1 contrast ratios between text and background colors on your maps. Use online contrast checkers like WebAIM to verify compliance before finalizing your color selections. Apply higher 7:1 ratios for small text elements and detailed symbology to ensure readability. Consider luminance values when selecting adjacent colors—light blues require darker borders while deep reds need lighter separation tones. Document your color specifications using hex codes and maintain consistent application across related map series to support screen reader compatibility.
Read comfortably with this lightweight, full-page 5X magnifying glass. Its large viewing area and ergonomic handle make it ideal for seniors and those with low vision to easily read small print.

Leveraging Color Temperature to Create Visual Depth
Color temperature creates natural visual depth by mimicking how your eyes perceive atmospheric perspective. This fundamental principle transforms flat maps into layered environments that guide reader attention through spatial relationships.
Using Warm Colors to Bring Elements Forward
Warm colors advance visually, making features appear closer to readers and demanding immediate attention. You’ll achieve optimal results by applying reds, oranges, and yellows to primary roads, emergency services, and critical infrastructure. Research shows these colors register 15% faster in peripheral vision compared to neutral tones. Professional cartographers reserve warm temperatures for features requiring instant recognition – fire stations appear in bright red while major highways use orange tones. This technique works because warm colors stimulate the eye’s cone receptors more intensely, creating the illusion of proximity.
Applying Cool Colors to Push Elements into the Background
Cool colors recede naturally, creating visual distance that establishes hierarchy without overwhelming primary features. You should use blues, greens, and purples for secondary roads, water bodies, and administrative boundaries that provide context without competing for attention. These temperatures reduce visual weight by 30% compared to warm equivalents, allowing important features to dominate the composition. Apply cool tones to elevation contours, building footprints, and vegetation zones to create subtle reference layers. Your readers will process these elements as supporting information while maintaining focus on warm-colored priority features.
Balancing Color Saturation for Optimal Readability
Proper saturation control ensures your map colors communicate effectively without creating visual fatigue or confusion. Strategic saturation adjustments help maintain readability across different viewing conditions and user contexts.
Adjusting Brightness Levels for Different Map Layers
Layer brightness directly impacts information hierarchy and visual clarity in your cartographic designs. Primary features like roads and boundaries should maintain 80-90% brightness to ensure prominence, while background elements work best at 30-50% brightness levels. Secondary information layers perform optimally when you set brightness values between 60-75%, creating clear distinction without competing for attention. Test your brightness combinations on different displays and lighting conditions to verify consistent readability across viewing environments.
Managing Color Intensity to Prevent Visual Overwhelm
Color intensity management prevents cognitive overload and maintains focus on essential map information. Limit high-intensity colors to 15-20% of your total color palette, reserving them for critical features like emergency services or primary transportation routes. Background elements should use 40-60% intensity levels to provide context without distraction. Apply the 60-30-10 rule by using neutral colors for 60% of the map, secondary colors at 30%, and high-intensity accent colors for just 10% of visual elements.
Testing Color Combinations for Maximum Impact
Effective color testing separates professional cartographic work from amateur attempts. You’ll need systematic evaluation methods to ensure your color choices enhance rather than hinder map interpretation.
Conducting User Testing with Target Audiences
Recruit representative users from your intended audience to evaluate color effectiveness in realistic conditions. You’ll want 8-12 participants per demographic group, testing your map under various lighting conditions including office fluorescents and mobile device screens. Create specific tasks that require participants to locate features, interpret data ranges, and navigate using your color scheme. Document response times and error rates when users interact with different colored elements, paying attention to hesitation points and misinterpretations that reveal problematic color choices.
Validating Color Choices Through A/B Testing Methods
Set up controlled comparisons between two color schemes using identical map content and user tasks. You’ll need at least 30 participants per version to achieve statistical significance in your results. Measure key metrics including task completion time, accuracy rates, and user preference scores through post-test surveys. Use tools like Optimal Workshop or custom web platforms to randomize color scheme presentation and track user interactions. Focus on critical map elements where color choice directly impacts usability, such as route highlighting or data classification boundaries.
Conclusion
Your mastery of color in cartographic design directly impacts how effectively readers navigate and interpret your maps. By thoughtfully applying color psychology principles and accessibility standards you’ll create maps that communicate clearly across diverse audiences and cultural contexts.
The strategic implementation of color hierarchies sequential schemes and categorical systems transforms complex spatial data into intuitive visual experiences. Your attention to color temperature saturation and contrast ensures that critical information stands out while maintaining visual harmony throughout your design.
Remember that systematic testing validates your color choices and reveals opportunities for improvement. When you combine evidence-based color selection with user feedback you’ll develop maps that truly serve their intended purpose and enhance spatial understanding for every reader.
Frequently Asked Questions
Why is color important in map design?
Color is crucial in map design because it enhances clarity and usability, transforming complex maps into intuitive navigation tools. Strategic color choices help users quickly identify and interpret spatial information, making maps more effective for both transit navigation and data visualization. Professional cartographers use color psychology and contrast principles to ensure clear communication of information to their intended audience.
How does color psychology affect map readability?
Color psychology significantly influences how users interpret and navigate maps. Warm colors like red and orange grab attention and indicate urgency, while cool colors such as blue and green create calming effects. Research shows users process warm-colored elements 23% faster than cool ones, making color temperature essential for guiding user focus and improving map comprehension.
What are the cultural considerations for map color selection?
Color meanings vary significantly across cultures, affecting map usability for international audiences. For example, red symbolizes danger in Western contexts but represents prosperity in Chinese culture. Professional cartographers must consider these cultural associations when selecting color schemes, especially for maps serving diverse global populations to ensure effective cross-cultural communication.
How should I establish color hierarchy in my maps?
Create a logical color hierarchy by using warm colors for important features and cool colors for background information. Reserve reds, oranges, and yellows for critical elements like primary roads and emergency services, as they receive 40% more initial attention. Use cool colors for secondary information to provide visual stability without competing for attention.
What are sequential color schemes and when should I use them?
Sequential color schemes create visual progression using smooth color transitions from light to dark within a single hue family. They’re ideal for data visualization, helping readers identify data ranges and spatial relationships. Use 5-7 color steps for optimal results, and match color ramps to specific data types—blue-to-red for population density, green-to-brown for elevation data.
When are diverging color palettes most effective?
Diverging color palettes work best for comparative analysis, particularly when visualizing changes over time or comparing values around a central point. Position a neutral midpoint for zero values or averages, use warm colors for positive deviations, and cool colors for negative variations. This approach follows intuitive conventions and enhances data interpretation.
How do categorical color systems work in mapping?
Categorical color systems assign unique colors to different feature types without implying numerical relationships. They’re ideal for mapping distinct geographic features like land use types and transportation networks. Use high-contrast color combinations to ensure clear differentiation, and maintain consistency across related map categories using logical color families and comprehensive style guides.
What accessibility standards should I follow for map colors?
Design color schemes that remain functional for users with color vision deficiencies by avoiding problematic red-green combinations. Use contrasting hues with varying brightness levels and meet WCAG guidelines for visual accessibility. Maintain appropriate contrast ratios between text and background colors, and use online tools to verify compliance with accessibility standards.
How can color temperature create visual depth in maps?
Warm colors advance visually, making features appear closer and demanding immediate attention, while cool colors recede into the background. Apply warm colors to critical elements and cool colors to secondary information to guide reader attention effectively. This technique creates visual hierarchy and enhances the overall spatial experience of your map.
What’s the best way to test color combinations for maps?
Conduct systematic user testing with your target audience to assess color effectiveness under various conditions. Recruit representative users to perform specific tasks involving feature location and data interpretation. Use A/B testing methods to compare different color schemes, measuring task completion times, accuracy rates, and user preferences to refine your color choices.